

- June 2, 2026
- 1
- News&Media
Week 21 points to a market that remains highly active, but slightly softer than the previous week
Total trading reached AED 7.67 billion in Week 21, down 2.4% from AED 7.86 billion last week. Land transactions reached AED 4.75 billion taking the total to AED 12.42 billion, 19% below last week’s overall market. Transaction activity also softened, with 4,254 transactions including land, compared with 4,567 last week, a decline of 6.9%.
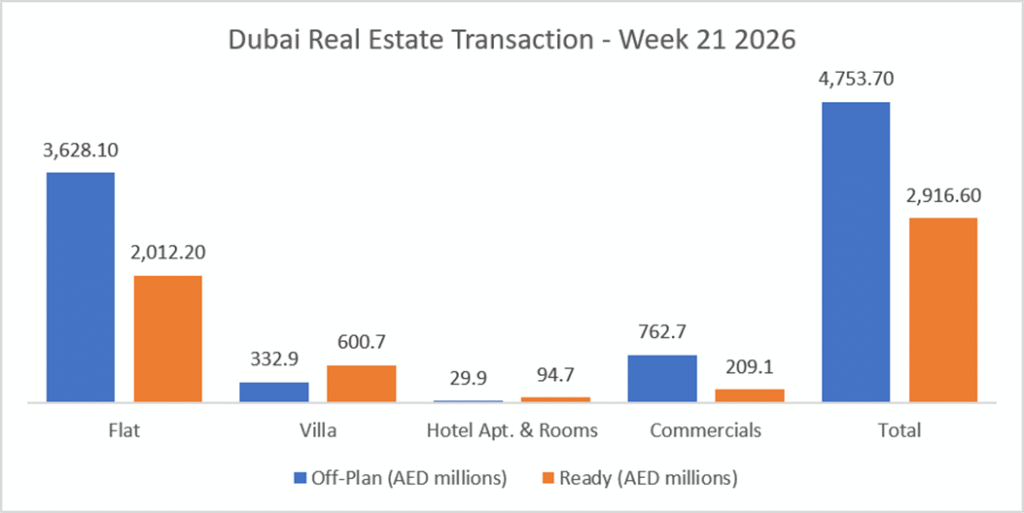
| Category | Off-Plan (AED millions) | Ready (AED millions) |
| Flat | 3,628.1 | 2,012.2 |
| Villa | 332.9 | 600.7 |
| Hotel Apt. & Rooms | 29.9 | 94.7 |
| Commercials | 762.7 | 209.1 |
| Total | 4,753.7 | 2,916.6 |
Off-Plan Market Performance
Total Value: AED 4.75 billion
Share of Weekly Total: 62.0%
| Sub-category | Value (AED millions) | % of Off-Plan |
| Flat | 3,628.1 | 76.3% |
| Villa | 332.9 | 7.0% |
| Hotel Apt. & Rooms | 29.9 | 0.6% |
| Commercials | 762.7 | 16.0% |
| Total | 4,753.7 | 100.0% |
Off-plan remained the clear driver of Dubai’s residential and commercial activity, accounting for nearly two-thirds of the week’s ex-land value. Flats continued to dominate, but the commercial segment was also meaningful, contributing AED 762.7 million, or 16.0% of total off-plan activity.
Top Performing Off-Plan Areas
| Area | Value (AED millions) | % of Off-Plan |
| Business Bay | 618.3 | 13.0% |
| Madinat Al Mataar | 592.1 | 12.5% |
| Dubai Islands | 550.9 | 11.6% |
| Dubai Harbour | 233.0 | 4.9% |
| Madinat Dubai Almela. | 184.1 | 3.9% |
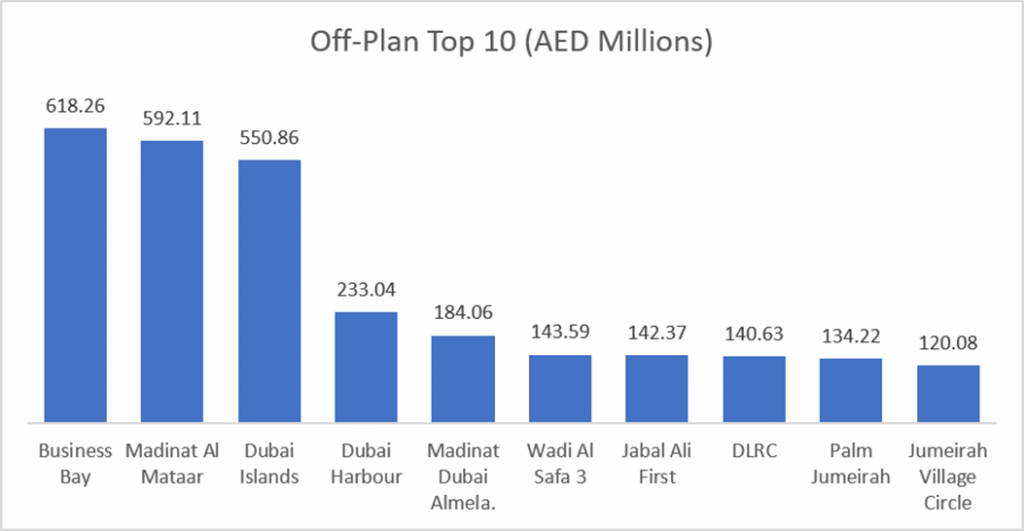
The top 10 off-plan areas generated AED 2.86 billion, equal to around 60.1% of all off-plan activity. Business Bay led the market, followed closely by Madinat Al Mataar and Dubai Islands, showing that demand was spread across both established investment districts and newer master-planned growth zones.
Ready Market Performance
Total Value: AED 2.92 billion
Share of Weekly Total: 38.0%
| Sub-category | Value (AED millions) | % of Ready |
| Flat | 2,012.2 | 69.0% |
| Villa | 600.7 | 20.6% |
| Hotel Apt. & Rooms | 94.7 | 3.2% |
| Commercials | 209.1 | 7.2% |
| Total | 2,916.6 | 100.0% |
Ready transactions were more balanced than off-plan, with villas taking a larger share of activity. Flats still led the segment at 69.0%, but ready villas contributed AED 600.7 million, or 20.6%, reflecting continued demand for completed family homes and prime secondary-market assets.
Top Performing Ready Areas
| Area | Value (AED millions) | % of Ready |
| Palm Jumeirah | 269.3 | 9.2% |
| Burj Khalifa | 266.9 | 9.2% |
| Business Bay | 184.2 | 6.3% |
| Dubai Marina | 170.3 | 5.8% |
| Jumeirah Village Circle | 142.0 | 4.9% |
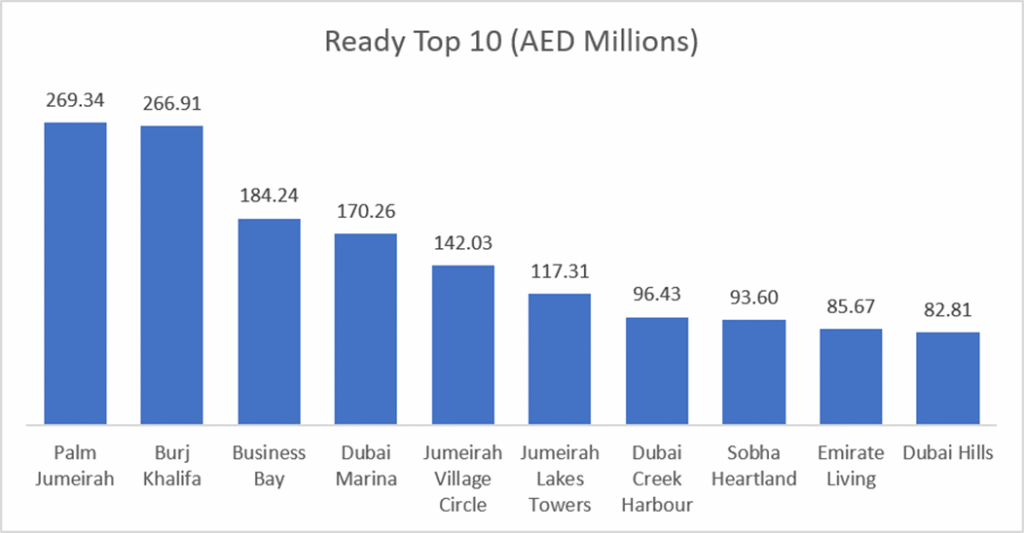
The top 10 ready areas accounted for AED 1.51 billion, or 51.7% of total ready-market value. Palm Jumeirah and Burj Khalifa were almost neck-and-neck at the top, underlining the continued strength of Dubai’s prime completed-property market.
Transaction Type Analysis
| Transaction Type | Off-Plan (AED millions) | Ready (AED millions) |
| Gifts | 298.7 | 277.9 |
| Mortgage | 30.0 | 1,079.9 |
| Sales | 4,424.9 | 1,558.8 |
The transaction-type breakdown shows a clear difference between the two markets. Off-plan activity was overwhelmingly sales-led, with AED 4.42 billion in sales representing 93.1% of total off-plan value. Mortgages were minimal in off-plan, at just AED 30.0 million, or 0.6%.
The ready market showed a very different liquidity profile. Sales still led at AED 1.56 billion, or 53.5% of ready value, but mortgages were substantial at AED 1.08 billion, representing 37.0% of ready-market activity. This reinforces the role of completed properties as the main financing-backed segment of the market.
On The Micro Level
The largest individual deal of the week was an off-plan flat in La Mer at AED 106.0 million, while The highest off-plan villa transaction was in The Waterside Villas by Ellington, Wadi Al Safa 3, at AED34.7 million.
The ready segment was led by a AED 60.0 million villa transaction on Palm Jumeirah. And the highest apartment transaction was AED 50.3 million, also in Palm Jumeirah.
These high-value deals show that luxury demand remains active across both the off-plan and completed-property markets.
Weekly Comparison
| Metric | Last Week | This Week | Change |
| Total Volume | AED 7.86 billion | AED 7.67 billion | -2.4% |
| Total Transactions | 4,567 | 4,254 | -6.9% |
Market Insights & Outlook
Week 21 points to a market that remains highly active, but slightly softer than the previous week. The decline in both value and transaction count suggests a modest cooling in weekly momentum, rather than a structural slowdown.
The bigger picture remains clear: off-plan continues to dominate Dubai’s transaction value, supported by strong apartment sales and sizeable commercial activity. Ready property demand remains healthy, particularly in premium locations such as Palm Jumeirah, Burj Khalifa, Business Bay and Dubai Marina, but the segment is more dependent on mortgage-backed transactions.
Land activity was also significant, reaching AED 4.75 billion, adding another major layer of liquidity beyond the off-plan and ready property market. Together, the numbers suggest that Dubai’s market is still attracting capital across multiple layers, new launches, completed homes, commercial assets and land, even as weekly volumes move through a more selective phase.
Data Source: Dubai Land Department
Only freehold transactions are included