

- April 20, 2026
- 4
- News&Media
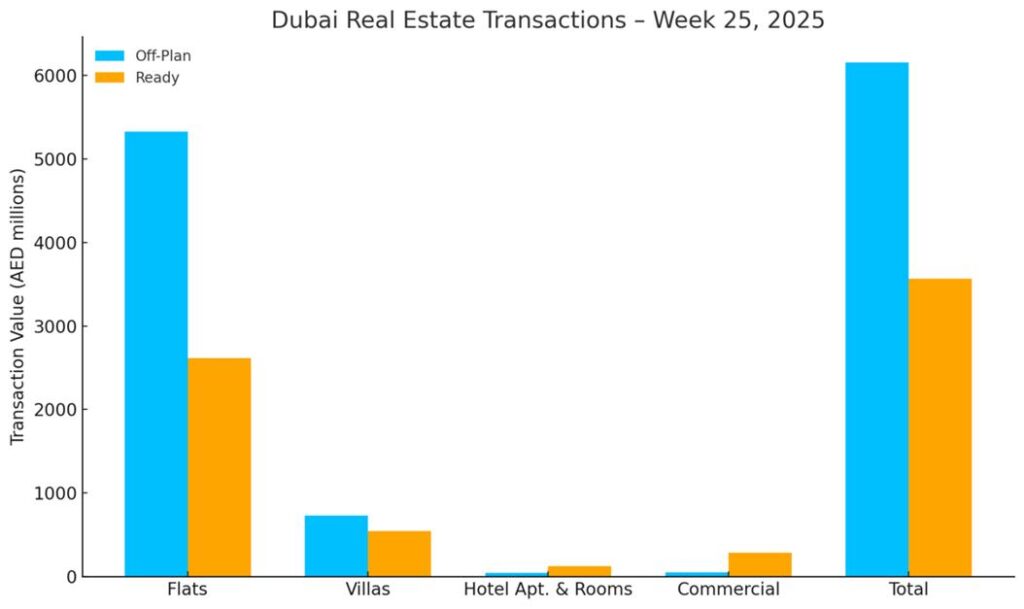
The total real estate transactions in Dubai for Week 25 was AED 9.72 billion and 4,907 transactions. Off-plan contributed 63.4% or 6.16 billion, while Ready properties contributed 36.6% or 3.56 billion.
In Week 25 of 2025, the total transactions reached AED 9.72 billion, a 9.2% increase compared to AED 8.90 billion recorded last week. The number of transactions also rose to 4,907 deals, up from 4,060 in the previous week, marking a strong increase in market activity across both off-plan and ready segments.
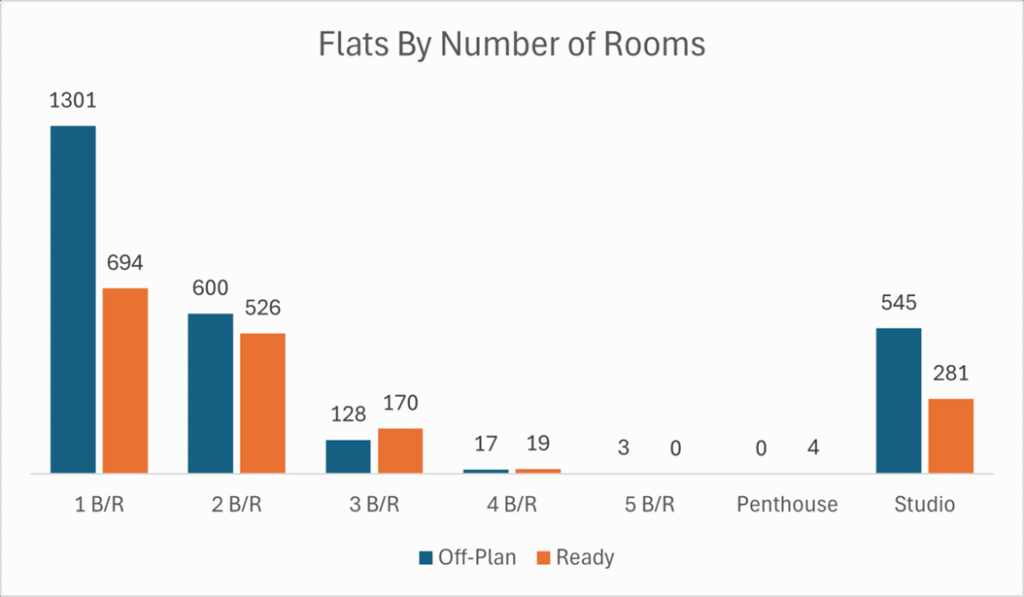
- One-bedroom Flats were the most traded, with 1,995 transactions.
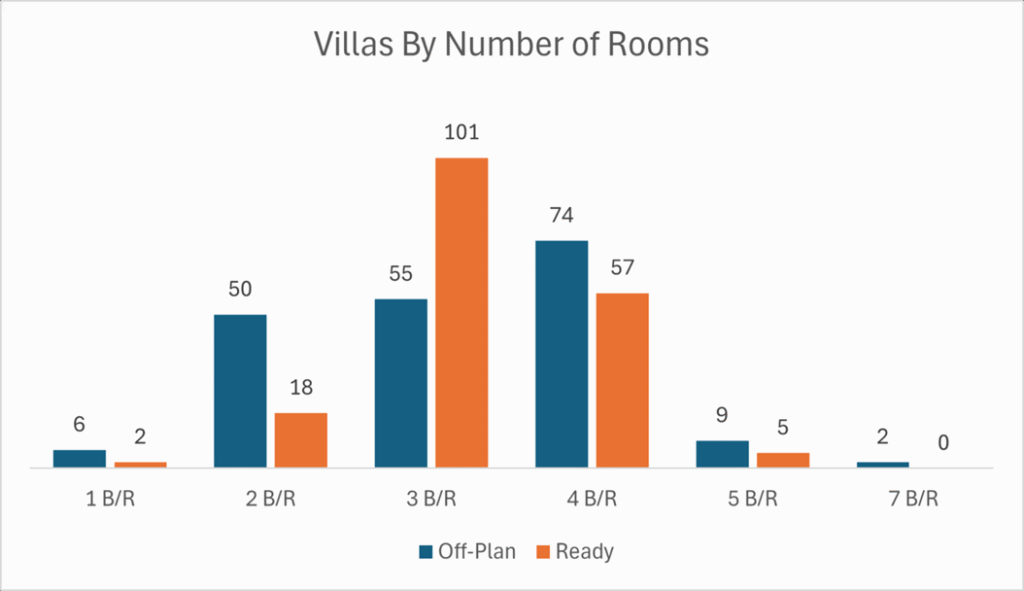
- 3-Bedroom & 4-Bedroom villas dominated the villas with 287 transactions combined.
- The total number of flats traded reached 4,288, while the villas accounted for 379 transactions.
| Category Off-Plan (AED Millions) Ready (AED Millions) Flats 5,324.6 2,611.8 Villas 732.6 542.8 Hotel Apts & Rooms 45.6 125.2 Commercials 53.8 284.8 Total 6,156.6 3,564.6 |
Off-Plan Market Performance
Total Value: AED 6.16 billion
Share of Total Transactions: 63.4%
The off-plan segment led the market this week, contributing 63.4% to the overall weekly transaction value. Among subcategories:
| Subcategory Value (AED millions) % of Off-Plan Flats 5,324.6 86.5% Villas 732.6 11.9% Hotel Apartments/Rooms 45.6 0.7% Commercial 53.8 0.9% Total 6,156.5 100% |
Flats remained the dominant off-plan asset class, accounting for over 86% of the segment’s value. Villas followed at 11.9%, while commercial units and hotel inventory together made up under 1.6%.
Top Performing Off-Plan Areas (by Value Traded)
| Area | Value (AED millions) |
| Palm Deira | 604.8 |
| Business Bay | 538.3 |
| Motor City | 303.3 |
| Madinat Dubai Almela | 270.4 |
| Al Khairan First | 270.2 |
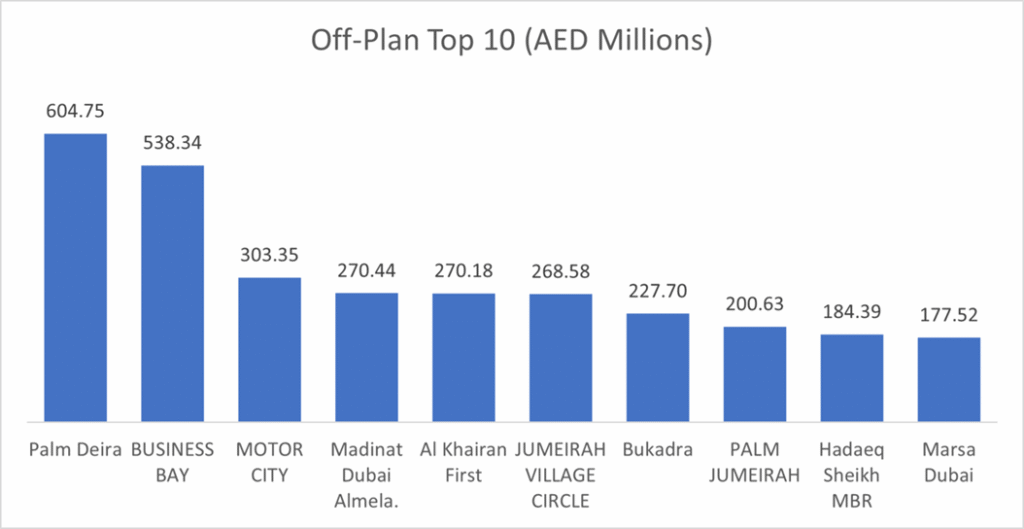
The top five areas alone accounted for AED 1.99 billion, or 32.3% of all off-plan transactions value this week.
Ready Market Performance
Total Value: AED 3.56 billion
Share of Total Transactions: 36.6%
The ready property market accounted for 36.6% of the total transaction value this week, with flats again leading the way:
| Subcategory | Value (AED millions) | % of Ready |
| Flats | 2,611.8 | 73.3% |
| Villas | 542.8 | 15.2% |
| Hotel Apartments/Rooms | 125.2 | 3.5% |
| Commercial | 284.7 | 8.0% |
| Total | 3,564.6 | 100% |
Top Performing Ready Areas (by Value Traded)
| Area | Value (AED millions) |
| Burj Khalifa | 507.0 |
| Jumeirah Lakes Towers | 318.5 |
| Business Bay | 274.8 |
| Dubai Marina | 226.6 |
| Jumeirah Village Circle | 188.6 |
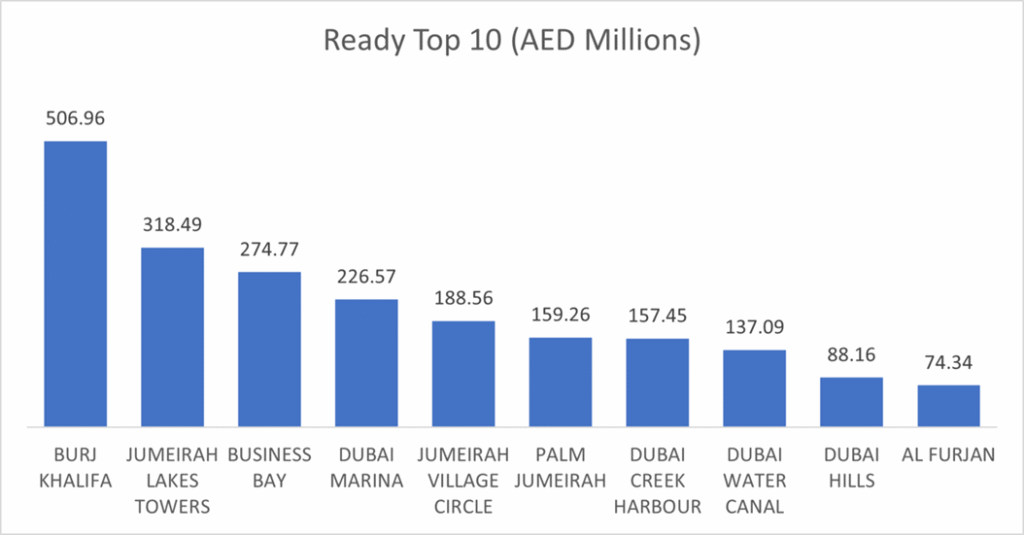
The top five areas generated AED 1.52 billion, or 42.5% of the ready properties transactions value.
On the micro level, below is the sales distribution based on the number of bedrooms
Weekly Comparison
| Metric Week 24 Week 25 Change Total Volume AED 8.90 billion AED 9.72 billion +9.2% Total Transactions 4,060 4,907 +20.9% |
Market Insights & Outlook
Week 25’s growth was driven by robust off-plan demand, particularly for flats, and a broadening buyer base in emerging communities such as Palm Deira and Business Bay. The ready segment, led by Burj Khalifa and Jumeirah Lakes Towers, held a healthy 36.6% share, reflecting sustained appetite for turnkey assets in prime districts. The concentration of value in top submarkets suggests continued investor focus on both high-growth corridors and landmark developments.