Dubai Real Estate Weekly Market Analysis 23rd-Jun-2025
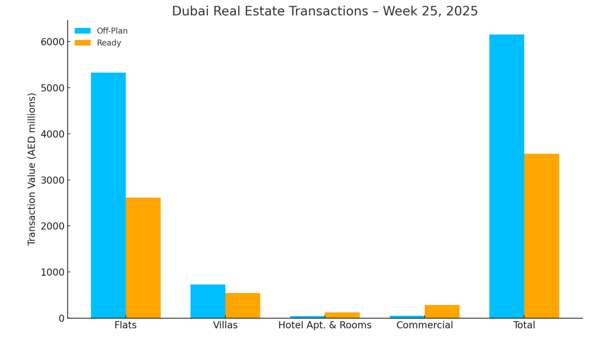
The total real estate transactions in Dubai for Week 25 was AED 9.72 billion and 4,907 transactions. Off-plan contributed 63.4% or 6.16 billion, while Ready properties contributed 36.6% or 3.56 billion.
In Week 25 of 2025, the total transactions reached AED 9.72 billion, a 9.2% increase compared to AED 8.90 billion recorded last week. The number of transactions also rose to 4,907 deals, up from 4,060 in the previous week, marking a strong increase in market activity across both off-plan and ready segments.
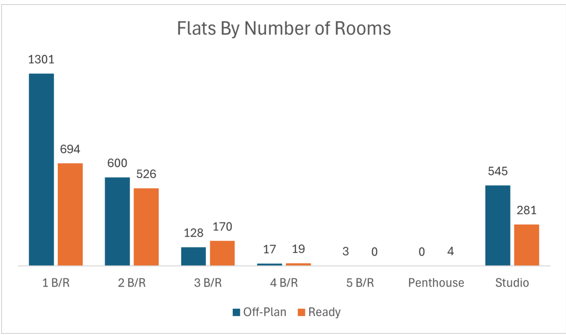
- One-bedroom Flats were the most traded, with 1,995
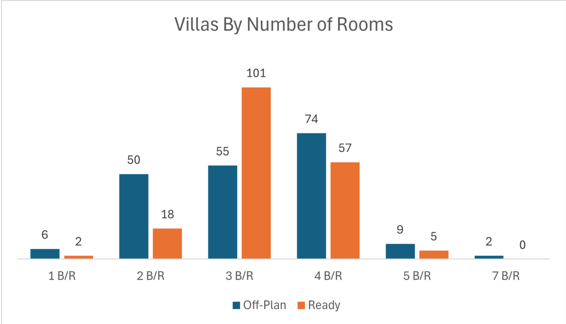
- 3-Bedroom & 4-Bedroom villas dominated the villas with 287 transactions combined.
- The total number of flats traded reached 4,288, while the villas accounted for 379
|
Off-Plan Market Performance
Total Value: AED 6.16 billion
Share of Total Transactions: 63.4%
The off-plan segment led the market this week, contributing 63.4% to the overall weekly transaction value. Among subcategories:
|
Flats remained the dominant off-plan asset class, accounting for over 86% of the segment’s value. Villas followed at 11.9%, while commercial units and hotel inventory together made up under 1.6%.
Top Performing Off-Plan Areas (by Value Traded)
| Area | Value (AED millions) |
| Palm Deira | 604.8 |
| Business Bay | 538.3 |
| Motor City | 303.3 |
| Madinat Dubai Almela | 270.4 |
| Al Khairan First | 270.2 |
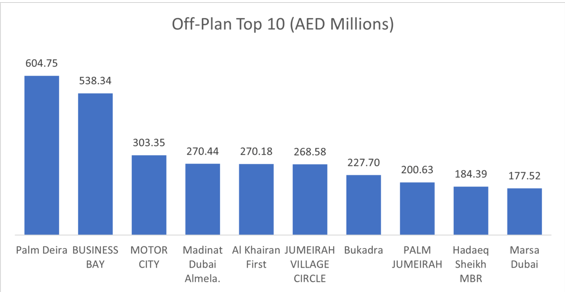
The top five areas alone accounted for AED 1.99 billion, or 32.3% of all off-plan transactions value this week.
Ready Market Performance
Total Value: AED 3.56 billion
Share of Total Transactions: 36.6%
The ready property market accounted for 36.6% of the total transaction value this week, with flats again leading the way:
| Subcategory | Value (AED millions) | % of Ready |
| Flats | 2,611.8 | 73.3% |
| Villas | 542.8 | 15.2% |
| Hotel Apartments/Rooms | 125.2 | 3.5% |
| Commercial | 284.7 | 8.0% |
| Total | 3,564.6 | 100% |
Top Performing Ready Areas (by Value Traded)
| Area | Value (AED millions) |
| Burj Khalifa | 507.0 |
| Jumeirah Lakes Towers | 318.5 |
| Business Bay | 274.8 |
| Dubai Marina | 226.6 |
| Jumeirah Village Circle | 188.6 |
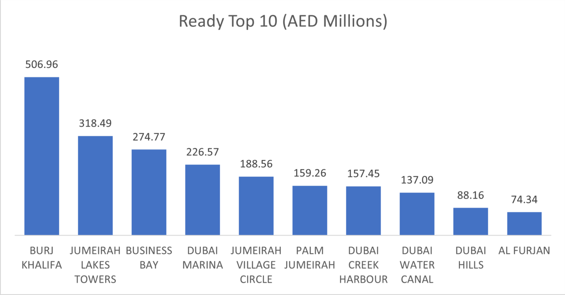
The top five areas generated AED 1.52 billion, or 42.5% of the ready properties transactions value.
On the micro level, below is the sales distribution based on the number of bedrooms
Weekly Comparison
|
Market Insights & Outlook
Week 25’s growth was driven by robust off-plan demand, particularly for flats, and a broadening buyer base in emerging communities such as Palm Deira and Business Bay. The ready segment, led by Burj Khalifa and Jumeirah Lakes Towers, held a healthy 36.6% share, reflecting sustained appetite for turnkey assets in prime districts. The concentration of value in top submarkets suggests continued investor focus on both high-growth corridors and landmark developments.
Recent Items
Dubai’s real estate market hits a record high of $89 b
Dubai’s real estate market hits a record high of $89 billion in the first half... Read More
DIFC Real Estate vs Dubai Land (DLD) Real Estate: A Comprehe
DIFC Real Estate vs Dubai Land (DLD) Real Estate: A Comprehensive Guide A comparison between... Read More

Surging Rents & Prices: A Deep Dive into Dubai & A
Surging Rents & Prices: A Deep Dive into Dubai & Abu Dhabi’s Property Boom 1.... Read More

Dubai’s Prime Residential Market Shows No Signs of Slowing
Dubai’s Prime Residential Market Shows No Signs of Slowing Down Dubai’s luxury residential market... Read More
Bluewaters Island: Dubai’s Iconic Waterfront Destination
Bluewaters Island: Dubai’s Iconic Waterfront Destination Bluewaters Island blends luxury residences, world-class attractions like Ain... Read More