Dubai Real Estate in 2026: Why the Market Holds Firm as Global Investors Seek Safe Assets

Dubai Real Estate in 2026: Why the Market Holds Firm as Global Investors Seek Safe Assets

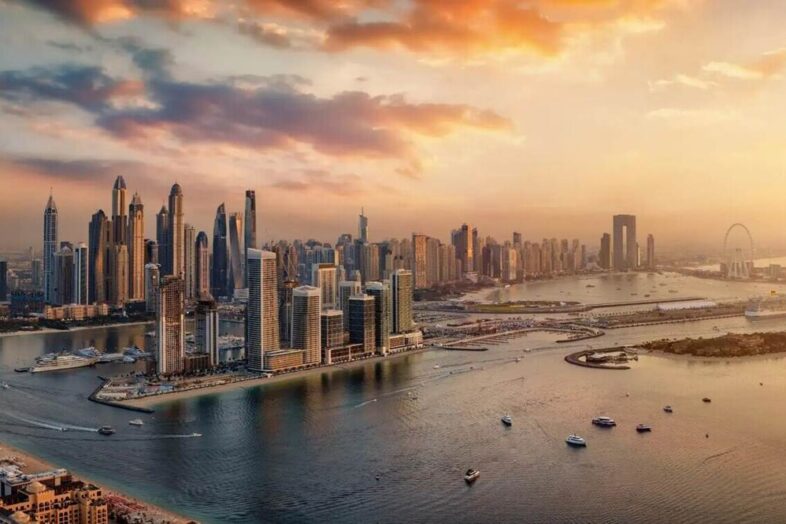
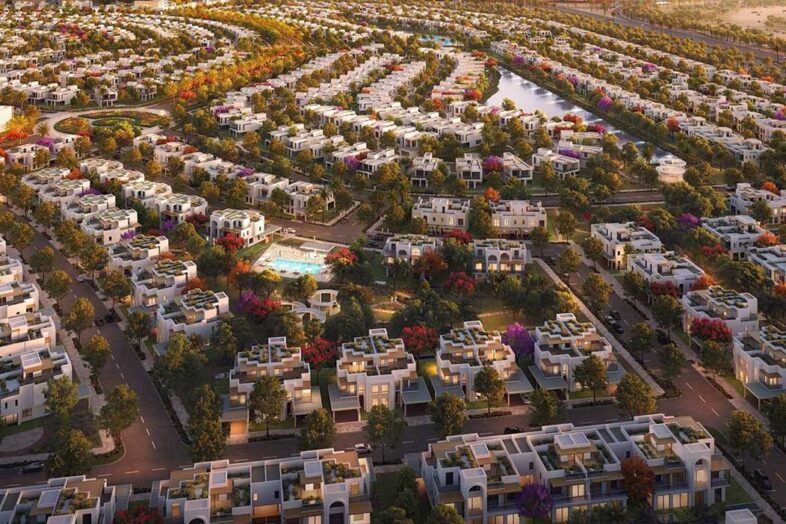
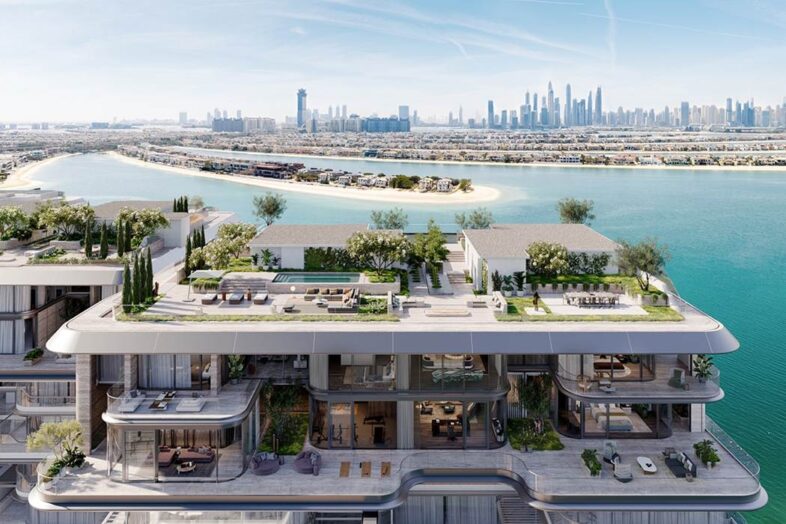
By Kiana Jehangir Dubai’s real estate market in 2026 continues to demonstrate resilience despite ongoing geopolitical uncertainty. While global conditions have introduced caution across financial markets, Dubai’s property sector has remained stable, supported by sustained investor demand and strong underlying fundamentals. Recent reporting indicates that rather than retreating, capital is continuing to flow into Dubai — particularly from international investors seeking stable, asset-backed opportunities.  Market Overview: Stability Amid Global Uncertainty Periods of geopolitical tension typically introduce volatility into global investment markets. However, Dubai’s real estate sector has historically exhibited a different pattern. Current observations show: This suggests that market conditions are not deteriorating, but rather adjusting within a stable framework. Safe-Haven Positioning: A Core Driver of Demand Dubai’s appeal as a real estate market is closely linked to its positioning as a safe-haven destination for capital. During periods of uncertainty, investors tend to prioritise: Dubai continues to meet these criteria through: As a result, uncertainty in other regions often reinforces, rather than weakens, Dubai’s attractiveness to global investors.  Historical Performance: Cyclical Resilience Dubai’s real estate market has demonstrated a consistent long-term pattern across previous economic cycles. Historical data indicates: For example: This pattern reinforces the view that Dubai’s property market is cyclical in pace, but upward in trajectory. Changing Buyer Composition: From Speculation to End-Use One of the most notable structural changes in recent years is the shift in buyer composition. Current data shows: This transition contributes to: The Role of Cash Buyers in Market Stability The composition of capital entering the market is also evolving. A growing share of transactions — particularly in the luxury segment — is being completed by cash buyers rather than leveraged investors. Implications include: This shift strengthens the market’s resilience, particularly in prime and ultra-prime segments. Segment Performance: Where Demand Remains Strongest Market resilience is not uniform across all segments. Prime and Ultra-Prime Residential Commercial and Income-Producing Assets Mid-Market Housing This segmentation highlights the importance of asset quality and location in determining performance. Global Capital Flows: Diversified and Selective Dubai’s investor base continues to expand geographically. Recent trends indicate: Institutional and large private investors are also maintaining exposure, focusing on assets that offer: Macroeconomic Context: Stability Beyond Oil While oil prices continue to influence regional sentiment, Dubai’s economy is now largely diversified. Key factors include: This reduces the direct correlation between oil price fluctuations and property market performance, reinforcing long-term stability. Pricing and Market Behaviour in 2026 Despite global uncertainty, there is no evidence of widespread price dislocation. Market indicators show: Short-term caution is present, but it has not translated into: Market Direction: Stability with Increased Selectivity Current conditions suggest that Dubai’s real estate market is entering a phase characterised by: Rather than rapid expansion, the market is showing signs of controlled and sustainable growth. The Noble House Perspective Dubai’s real estate market in 2026 reflects a combination of resilience, diversification, and sustained global demand. The continued inflow of capital during periods of uncertainty indicates that: For market participants, the key focus should remain on: As global conditions evolve, Dubai’s property market continues to demonstrate that stability — rather than short-term momentum — is its defining characteristic.

Dubai Real Estate in 2026: Why Landlords Are Holding Firm Despite Rising Listings

Dubai Real Estate in 2026: Why Landlords Are Holding Firm Despite Rising Listings

By Kiana Jehangir Dubai’s property market in 2026 is showing a notable shift in behaviour rather than direction. While listings have increased modestly, there is no evidence of widespread distress selling. Instead, landlords are maintaining their positions, and pricing levels remain broadly stable. This dynamic reflects a market that is adjusting in pace, not reversing — with both buyers and tenants becoming more selective, and investors continuing to rely on long-term fundamentals rather than short-term sentiment. Market Overview: Stability Despite External Pressures Recent data indicates that Dubai’s property market has remained resilient, even amid geopolitical uncertainty. Approximately 85% of landlords are not considering selling, reinforcing the absence of panic-driven activity.  This behaviour suggests: Rather than a supply-driven correction, the market is exhibiting measured stability, supported by long-term investment perspectives. Listings Increase, But Without Distress Signals Property listings have risen by approximately 5%, but the composition of this increase is significant. Key observations: This indicates that the increase in inventory is primarily due to normal market churn, rather than a structural shift in supply conditions.  Landlord Behaviour: Long-Term Conviction Remains Intact The decision by most landlords to hold their assets reflects continued confidence in Dubai’s structural advantages. These include: As noted in the report, many landlords are responding to real-time market conditions rather than reacting to external headlines.  This behaviour is consistent with a market where ownership is increasingly driven by long-term positioning rather than short-term speculation. Buyer Trends: Shift Toward Off-Plan and Future Supply While landlords remain stable, buyer behaviour is evolving. Recent transaction patterns show: This shift reflects a more strategic approach to investment, where buyers: The preference for off-plan properties indicates confidence in Dubai’s long-term growth trajectory, even as near-term conditions are assessed more cautiously.  Rental Market Adjustments: Segment-Specific Pressure While overall stability persists, certain segments are experiencing pressure. Short-Term Rental Segment Long-Term Rental Segment These trends suggest that rental market adjustments are not uniform, but instead concentrated in specific asset classes. Pricing Dynamics: Stability With Slower Transaction Cycles Property prices across both sales and rental markets have remained broadly stable. However, adjustments are visible in transaction activity rather than pricing levels. Market indicators include: Buyer engagement has shown resilience, with activity returning to over 80% of typical levels shortly after temporary slowdowns.  This pattern reflects caution rather than withdrawal. Increasing Importance of Asset-Level Performance As the market becomes more selective, performance is increasingly determined at the individual asset level. Key differentiators now include: Landlords are increasingly required to assess: This marks a shift from broad market-driven performance to asset-specific competitiveness. Market Segmentation: Diverging Risk Profiles Risk exposure is becoming more differentiated across the market. Investor-Dominated Communities Mortgage-Dependent Segments Prime and Luxury Assets This segmentation highlights the importance of location and asset quality in determining performance. Market Direction: Adjustment in Pace, Not Trend Current data suggests that Dubai’s real estate market is not experiencing a downturn, but rather a shift in behaviour. Key characteristics of this phase: The market is transitioning from rapid growth to a more measured and selective environment, where decisions are increasingly driven by value and fundamentals. The Noble House Perspective The current market conditions reflect a structural shift toward maturity rather than instability. The absence of panic selling, combined with stable pricing and sustained investor participation, indicates that Dubai’s real estate market continues to be supported by long-term fundamentals. For investors and property owners, the focus should remain on: As the market becomes more selective, performance will be increasingly determined by fundamentals rather than broad market momentum.

Dubai Real Estate in 2026: How Wellness-Integrated Homes Are Redefining Luxury

Dubai Real Estate in 2026: How Wellness-Integrated Homes Are Redefining Luxury

By Kiana Jehangir Dubai’s luxury real estate market is undergoing a clear structural shift. Traditional markers of prestige — location, scale, and visual appeal — are no longer sufficient to define high-end property. Instead, a new framework is emerging, where wellness integration is becoming a central component of residential value. Recent reporting highlights that developers are increasingly embedding health-focused design into residential projects, reflecting a broader change in buyer priorities.  This shift is not cosmetic. It represents a measurable transition in how luxury is defined, evaluated, and priced within the Dubai property market. The Shift in Luxury: From Aesthetics to Functionality Historically, luxury property in Dubai was characterised by: While these factors remain relevant, they are no longer the primary differentiators. Developers are now focusing on how homes perform as living environments, including their ability to support: This reflects a broader trend in the UAE, where design is increasingly judged by function, usability, and long-term value, rather than visual impact alone.  What Defines a Wellness-Integrated Home Wellness in real estate extends beyond traditional amenities such as gyms or spas. According to current market insights, wellness-integrated homes typically include: These features are integrated at the design and infrastructure level, rather than added as optional amenities. In many developments, wellness is embedded into: This represents a shift from amenity-based luxury to environment-based luxury. Buyer Behaviour: Demand Driven by Lifestyle and Longevity The rise of wellness-integrated homes is closely linked to changing buyer behaviour. Current trends indicate that buyers are: This is particularly relevant in Dubai, where high-performance lifestyles and long working hours have increased demand for residential environments that offer balance and recovery.  As a result, wellness is no longer viewed as a premium add-on, but as a core requirement in high-end residential decision-making. Market Performance: Measurable Impact on Value The integration of wellness features is not only influencing buyer preferences, but also measurable market performance. Data suggests that wellness-oriented developments: These outcomes indicate that wellness is increasingly linked to financial performance, not just lifestyle appeal.  For investors, this introduces a new evaluation metric:Properties that support long-term tenant satisfaction and retention may outperform those defined solely by location or branding. Developer Strategy: A Structural Market Response Developers are responding directly to this shift in demand. Recent projects across Dubai are incorporating: This aligns with a broader industry trend, where wellness is becoming a standard component of new developments, rather than a niche offering.  The pace of adoption in Dubai is particularly notable, with wellness concepts being implemented across both emerging districts and established urban areas. Urban Implications: Redefining Community Design The shift toward wellness is also influencing how entire communities are planned. Emerging development patterns include: These changes indicate that wellness is no longer confined to individual properties. It is shaping district-level planning and urban design. In effect, the definition of luxury is expanding from the unit to the community ecosystem. Market Positioning: Dubai in a Global Context Dubai’s rapid adoption of wellness-integrated real estate places it within a broader global trend. Across international markets, there is increasing emphasis on: However, Dubai’s advantage lies in the speed of implementation. Wellness concepts are being incorporated into large-scale developments at a pace that is reshaping the overall market structure. This positions Dubai as a leading market in the evolution of lifestyle-driven real estate. Investment Considerations in 2026 For investors, the shift toward wellness introduces new criteria for evaluating property. Key considerations include: As the market becomes more selective, properties lacking these characteristics may face slower absorption and reduced competitiveness. The Noble House Perspective The rise of wellness-integrated homes reflects a broader transition in Dubai’s real estate market — from asset-driven luxury to experience-driven living. This shift is supported by: For market participants, the implication is clear:Luxury is increasingly defined by how a property functions over time, rather than how it presents initially. In 2026, the strongest-performing assets are likely to be those aligned with long-term livability, health, and sustainability, as these factors continue to shape demand across the market.

Dubai Real Estate Weekly Market Analysis 20-Apr-2026

Dubai Real Estate: Equity Volatility vs Physical Market Resilience

An Investor Briefing on March 2026 Dislocation Prepared for: Institutional and Strategic InvestorsDate: 14 March 2026Confidential Executive Summary Between 27 February and 12 March 2026, the DFM Real Estate Index declined 21.4%, wiping out approximately $248.7 billion in developer market capitalization as regional conflict escalated [1][2]. Headlines framed this as the onset of a property crash. However, physical market data tells a different story: transaction volumes rose 12% week-on-week during the height of the selloff, and price discounts remained in the 5.8–9.2% range for the most sensitive segments [3][4]. This briefing examines the disconnect between listed sentiment and physical market fundamentals, contextualizes the current dislocation against Dubai’s previous cycles, and outlines scenario-based implications for institutional investors. Market Dislocation: Equities vs Physical Assets The divergence between equity markets and property transactions is stark and quantifiable. Metric Equity Market Physical Market DFM Real Estate Index (27 Feb–12 Mar)   -21.4% N/A Emaar Properties   -24.1% N/A Aldar Properties   -19.8% N/A Weekly transactions (2–9 March) N/A +12% WoW Transaction value (2–9 March) N/A AED 11.93bn Price discounts (distressed segments) N/A 5.8–9.2% Table 1: Equity vs physical market performance during conflict escalation While listed developers surrendered nearly a quarter of their market value in two weeks, the physical market absorbed heightened uncertainty with modest single-digit price adjustments and rising transaction volumes [1][3]. This suggests that equity markets are pricing in tail-risk scenarios that the transaction ledger does not yet validate. Figure 1: DFM Real Estate Index drawdown, late February to mid-March 2026 Figure 2: Weekly property transactions remained resilient during equity market selloff Historical Context: Why 2026 Is Not 2008 Dubai has experienced two major property corrections in recent history, each with distinct drivers and outcomes. 2008–2009: Global Financial Crisis Real estate represented approximately 80–85% of Dubai’s GDP when the crisis hit[5][6]. Excessive leverage, speculative oversupply, and a global credit freeze produced a 40% decline in Q1 2009 alone and up to 60% peak-to-trough in certain segments[5][6]. Abu Dhabi provided emergency liquidity support, and recovery required multi-year restructuring. 2020–2021: COVID Shock and Recovery The pandemic produced an 8–10% price correction, but Golden Visa reforms and capital inflows from Russia and Europe triggered a 50–60% rebound in prime segments within 18–24 months [7][8]. 2026: Regional Conflict Without Systemic Leverage The current environment differs in three critical respects: Major real estate advisory firms—including Knight Frank, JLL, Savills, and Colliers—project base-case price adjustments in the low single digits to mid-teens for 2026, assuming no major escalation [3][5][9]. None forecast the 50–70% crash scenarios circulating on social media. Even in a tail-risk escalation scenario, the absence of 2008-style systemic leverage argues against a repeat of that era’s 60% drawdown. Scenario Analysis and Probability-Weighted Outcomes We outline three plausible scenarios for the next 12–18 months, with indicative probability weights based on current strategic consensus. Scenario Prob. Description DFM Index Physical Prices Rapid de-escalation (Q2) 45% Tourism recovers, capital returns to GCC hub +15% to +25% Flat to +5% Contained attrition (2026) 40% Slower tourism, partial capital rotation 0% to +10% -10% to -20% Major escalation (tail risk) 15% Severe regional risk-off, no 2008-style GFC -30% to -40% Deeper but <2008 Table 2: Scenario probability framework for Dubai real estate In the base case (rapid de-escalation), the equity market would likely retrace much of its panic-driven decline as Dubai’s structural advantages—zero income tax, business-friendly regulation, and infrastructure quality—reassert themselves [9][10]. The physical market, having demonstrated resilience during the selloff, would stabilize near current levels. In a protracted but contained conflict, the primary risk is a grinding 10–20% correction in tourism-dependent and fringe-location assets, with stronger developers consolidating market share [5][9]. Even in a tail-risk escalation, the improved fundamentals relative to 2008—lower systemic leverage, tighter supply controls, and a more diversified economy—suggest that any correction would be cyclical rather than structural. Capital Flow Dynamics: Rotation, Not Exodus Some high-net-worth capital is rotating out of Dubai, but flows remain modest relative to the scale of the equity market repricing. Against nearly $250 billion in listed developer losses, these outflows represent portfolio rebalancing at the margin, not a structural exodus [1][2]. The money is not broadly leaving Dubai; the listed multiples are repricing the region’s risk premium. Historical Pattern: Sentiment Overshoots, Structure Prevails Every major dislocation in Dubai’s modern financial history has followed the same pattern: listed sentiment overshoots to the downside first and recovers last, while the physical market adjusts more slowly but ultimately tracks underlying economic fundamentals. The current gap between the DFM index and the transaction ledger fits this historical template. For investors with multi-year horizons and the capacity to bear volatility, this type of dislocation has historically generated strong risk-adjusted returns. Investment Implications For institutional investors, the opportunity is not a broad “buy Dubai” thesis, but a disciplined, targeted approach: The historical precedent is clear: when the gap between Dubai’s stock market narrative and its real-estate structure has closed, it has typically closed in favour of the structure. Investors who can price scenarios soberly and allocate capital with discipline may be positioned for significant medium-term returns. References [1] DFM Real Estate Index data, 27 February – 12 March 2026. Bloomberg Terminal. [2] PwC. (2026). Emerging Trends in Real Estate: Global 2025. https://www.pwc.com/gx/en/industries/financial-services/real-estate/emerging-trends-real-estate/etre-global-outlook.html [3] Property Finder. (2025). Dubai real estate market achieves all-time high in Q2 2025 with AED 184.3bn in sales transactions. https://www.propertyfinder.com/news/dubai-real-estate-market-achieves-all-time-high-in-q2-2025 [4] Knight Frank & Bayut transaction data, March 2026 (internal estimates based on public disclosures). [5] McKinsey & Company. (2026). Global private markets in real estate. https://www.mckinsey.com/industries/private-capital/our-insights/global-private-markets-report/real-estate [6] Aberdeen Investments. (2025). Global real estate market outlook Q2 2025. https://www.aberdeeninvestments.com/en-ae/institutional/insights-and-research/global-real-estate-market-outlook-q2-2025 [7] ACUMA. (2025). UAE real estate drives economic growth in 2025. https://www.acuma.com/news/UAE-real-estate-emerges-as-engine-of-economic-growth [8] FAM Properties. (2026). Dubai Real Estate Market 2025 Recap: Record Dh917B Year. https://famproperties.com/blog/dubai-real-estate-market-2025-recap-record-year [9] CBRE. (2025). UAE Real Estate: Economic Growth Fuels Demand as Supply Increases. https://www.cbre.ae/press-releases/uae-real-estate-market-review-q3-2025 [10] The National News. (2025). UAE Central Bank raises economic growth forecast for 2025. https://www.thenationalnews.com/business/2025/09/19/uae-economy-gdp/ [11] Technavio. (2025). Residential Real Estate Market Analysis, Size, and Forecast 2025-2030. https://www.technavio.com/report/residential-real-estate-market-analysis

Dubai Real Estate Market Review 24-Apr-2026

Dubai Housing Demand Projection 2026-2035

3% Annual Population Growth Scenario Prepared for: Rashid JehangirDate: March 13, 2026Location: Dubai, UAE Executive Summary This report analyzes Dubai’s residential housing needs under a conservative growth scenario that accounts for regional geopolitical tensions, including the ongoing Iran conflict and recent security incidents in Dubai. The projection applies to a cautious 3% annual growth rate for 2026-2027, followed by recovery to pre-crisis growth rates for 2028-2035. Key Findings: Methodology and Assumptions Population Base Dubai’s 2026 resident population is estimated at approximately 4.47 million [1]. This represents the starting baseline for all projections in this analysis. Growth Rate A conservative, phased growth rate approach is applied to reflect current geopolitical realities: This conservative approach accounts for potential short-term headwinds from regional tensions while recognizing Dubai’s historical resilience and diversification strategies [1][8]. Household Formation The analysis uses an average household size of 4 persons per household, consistent with Dubai’s observed patterns [2][3]. In 2024, Dubai added 59,610 new households with an average size of 4 people, supporting this assumption [2]. Calculation Formula For each year: Where: Geopolitical Context and Risk Factors Regional Security Environment (March 2026) Dubai’s real estate market operates within a complex regional security landscape that influences population flows and investor sentiment: Conservative Modeling Approach Given these factors, this analysis adopts a conservative stance for the 2026-2027 period: However, the model assumes recovery from 2028 onward based on: 5-Year Housing Demand Projection (2026-2030) Year Population Annual Increase New Homes Cumulative Homes   (millions) (people) Needed 2026-Year 2026 4.60 134,000 33,500 33,500 2027 4.74 138,000 34,500 68,000 2028 4.88 142,000 35,500 103,500 2029 5.03 147,000 36,750 140,250 2030 5.18 151,000 37,750 178,000 Total +0.71M 712,000 177,500 – Table 1: Five-year housing demand projection for Dubai (2026-2030) Key Insights: 5-Year Period 10-Year Housing Demand Projection (2026-2035) Year Population Annual Increase New Homes Cumulative Homes   (millions) (people) Needed 2026-Year 2026 4.60 134,000 33,500 33,500 2027 4.74 138,000 34,500 68,000 2028 4.88 142,000 35,500 103,500 2029 5.03 147,000 36,750 140,250 2030 5.18 151,000 37,750 178,000 2031 5.34 155,000 38,750 216,750 2032 5.50 160,000 40,000 256,750 2033 5.67 165,000 41,250 298,000 2034 5.84 170,000 42,500 340,500 2035 6.02 176,000 44,000 384,500 Total +1.55M 1,538,000 384,500 – Table 2: Ten-year housing demand projection for Dubai (2026-2035) Key Insights: 10-Year Period Market Context and Comparisons Historical Performance Dubai’s residential market has demonstrated capacity to absorb significant new supply in recent years: Supply Pipeline According to recent forecasts, Dubai’s residential development pipeline includes [6][7]: Demand-Supply Balance Period Projected Demand Reported Pipeline Balance   (3% growth) (market forecasts)   2026 33,500 units 160,000 units [6] Oversupply 2026-2030 177,500 units Data not specified – 2026-2035 384,500 units – – Table 3: Comparison of projected demand versus reported supply pipeline Note: The 2026 pipeline figure of 160,000 units likely includes planned, under-construction, and speculative projects, not all of which will be completed in 2026[6]. Actual annual completions typically run lower than total planned units. Geopolitical Impact on Supply-Demand Balance Current regional tensions introduce additional considerations: Sensitivity Analysis Impact of Household Size Variations Household size significantly affects housing demand calculations. The table below shows how annual 2026 demand varies with different household size assumptions: Household Size 2026 New Homes Needed vs. Base Case (persons/household)     3.0 persons 44,700 +33% 3.5 persons 38,300 +14% 4.0 persons (base) 33,500 baseline 4.5 persons 29,800 -11% 5.0 persons 26,800 -20% Table 4: Sensitivity of housing demand to household size assumptions Dubai’s household size has remained relatively stable at approximately 4 persons per household based on recent data [2][3]. However, shifts in demographic composition, housing preferences, or regulatory changes could alter this metric over time. Impact of Growth Rate Variations The 3% annual growth rate is a scenario assumption. Actual growth may vary based on economic conditions, policy changes, and geopolitical factors: Growth Rate 2026 Demand 5-Year Total 10-Year Total 2.0% 22,400 115,000 244,000 2.5% 27,900 145,000 312,000 3.0% (base) 33,500 177,500 384,500 3.5% 39,100 211,000 461,000 4.0% 44,700 246,000 542,000 Table 5: Sensitivity of housing demand to population growth rate assumptions Geopolitical scenario analysis: Implications for Real Estate Market Developer Planning Investment Considerations Policy and Infrastructure Limitations and Considerations Model Assumptions This analysis makes several simplifying assumptions: Additional Demand Factors Beyond population growth, several factors influence actual housing demand: Market Dynamics Real estate markets rarely operate in perfect equilibrium: Conclusion Under a conservative growth scenario that accounts for current geopolitical headwinds, Dubai will require substantial new housing supply over the coming decade. The analysis projects: These figures represent baseline demand from population growth alone, assuming 4 persons per household. Actual market requirements will be influenced by investor activity, replacement demand, demographic shifts, economic conditions, and most critically, the evolution of regional geopolitical tensions. Risk-Adjusted Perspective The conservative 3% growth rate for 2026-2027 provides downside protection but may prove pessimistic if: Conversely, risks remain if regional conflicts escalate, security incidents increase in frequency, or global economic conditions deteriorate beyond current assumptions. Strategic Implications Current development pipelines appear robust, with significant planned supply for 2026 and beyond [6][7]. In the current environment: Continuous monitoring of population trends, household formation patterns, supply delivery, and crucially, regional security developments will be essential for maintaining market balance and supporting sustainable growth in Dubai’s residential sector. References [1] Global Media Insight. (2026, March 9). United Arab Emirates (UAE) Population Statistics 2026. https://www.globalmediainsight.com/blog/uae-population-statistics/ [2] Emirates 24/7. (2025, April 30). Dubai’s Peak-Time Population Hits 5.13 Million, 59,600 New Households Added in 2024. https://www.emirates247.com/uae/dubai-s-peak-time-population-hits-5-13-million [3] CEIC Data. (2015, November 30). United Arab Emirates Average Size of Households: Census: Dubai. https://www.ceicdata.com/en/united-arab-emirates/size-of-households-average/average-size-of-households-census-dubai [4] Khaleej Times. (2025, November 23). 470 New Residents, Only 150 Homes a Day: Dubai’s Population Outpacing Residential Supply. https://www.khaleejtimes.com/business/markets/dubai-population-outpacing-residential-supply [5] Gulf News. (2025, September 4). Dubai Records Fastest Population Growth in Its History, Surpassing 4 Million Residents. https://gulfnews.com/uae/dubai-records-fastest-population-growth-in-its-history-surpassing-4-million-residents-1.500258586 [6] Elite Property DXB. (2026, February 9). Dubai Real Estate Market Forecast 2026: 160,000 New Residential Units Planned. https://elitepropertydxb.com/blogs/dubai-real-estate-market-forecast-2026-160000-new-residential-units-planned [7] Gulf News. (2026, February 17). UAE to Add 390,000 New Homes by 2030: Impact on Prices and Rents. https://gulfnews.com/business/property/uae-to-add-390000-new-homes-by-2030-what-it-means-for-prices-rents-1.500447193 [8] Note: Geopolitical context …

Dubai Real Estate Market Review 22-Apr-2026

JUMEIRAH VILLAGE CIRCLE (JVC)

COMPREHENSIVE REAL ESTATE INVESTMENT GUIDE & MARKET ANALYSIS 2026 Report Date: January 2026 Location: Jumeirah Village Circle, Dubai, United Arab Emirates Report Scope: Complete Investment Analysis for Institutional & Individual Investors EXECUTIVE SUMMARY Market Overview & Key Metrics Jumeirah Village Circle (JVC) has emerged as Dubai’s premier master-planned family community and one of the most attractive investment destinations in the UAE real estate market. With over 20 years of proven track record since its launch in 2005 by Nakheel, JVC represents a unique convergence of established stability, continuous modernization, and future growth potential. Key Market Metrics (January 2026): Metric Value Market Position Average Apartment Price AED 1,340,000 69% below Dubai average (AED 4,330,000) Average Price Per Sq.Ft. AED 1,461 Significantly below citywide average Gross Rental Yield 7-9% Above Dubai average of 5-6% Net Rental Yield 6.5-7.5% Optimal for long-term investors Annual Price Appreciation 11%+ YoY Consistent outperformance Community Area 870+ Hectares 10 integrated districts Property Resale Timeline 45-60 days High liquidity Freehold Status 100% Full ownership benefits Current Population 150,000+ Established, thriving community Projected Population by 2030 250,000+ 67% growth potential Strategic Position Located strategically on Sheikh Zayed Road with direct highway connectivity, JVC bridges the gap between: Investment Attractiveness JVC appeals to three distinct investor profiles: SECTION 1: DEVELOPMENT HISTORY & CURRENT STATUS Historical Development (2005-2025) Phase 1: Foundation (2005-2010) Phase 2: Consolidation (2010-2018) Phase 3: Modernization (2018-2024) Phase 4: Growth (2024-Present) Current Status (January 2026) Occupancy & Development: Infrastructure Maturity: Future Development Pipeline (2026-2030) Upcoming Major Projects: Project Name Developer Units Completion Property Type Price Range Olivo Park Residences Developer 1,400+ 2026-2027 Apartments (1-2 BR) AED 1.2-1.8M Binghatti Grove Phase 2 Binghatti 800+ 2026-2027 Apartments (1-3 BR) AED 1.1-2.2M Aurora Residences Expansion Binghatti 600+ 2027 Mixed-Use AED 1.0-1.9M Five Hotel Residences Nakheel 250+ 2027 Luxury Apartments AED 1.8-3.5M District 11 Development Multiple 3,000+ 2027-2028 Mixed AED 800K-3M Suburban Villas Phase 3 Nakheel 4,500+ 2028-2029 Villas (3-5 BR) AED 2.5-6M Total Pipeline Through 2028: 27,082 units (representing 35% growth from current stock) Dubai Metro Blue Line Impact (Completion: September 2029) The upcoming Dubai Metro Blue Line extension will dramatically enhance JVC’s connectivity: Planned JVC Metro Stations: Projected Impact: SECTION 2: ARCHITECTURAL EXCELLENCE & COMMUNITY DESIGN Master Plan Philosophy JVC’s design embodies forward-thinking urban planning principles: Circular Configuration Benefits: Green Space Integration: Architectural Standards Building Design Principles: Residential Typologies: SECTION 3: RESIDENTIAL PROPERTY SEGMENTS ANALYSIS Villa Market Segment Current Market Data (January 2026): Villa Type Size (Sq.Ft.) Price Range Price/Sq.Ft. Avg. Rental 3-Bedroom 3,000-3,800 AED 2.2-3.2M AED 770-900 AED 120-140K 4-Bedroom 4,000-5,000 AED 3.0-4.5M AED 800-950 AED 140-180K 5-Bedroom 5,000-6,500 AED 4.5-7.0M AED 850-1,100 AED 180-250K 6-Bedroom Luxury 6,500+ AED 7.0-12M+ AED 1,100+ AED 250-350K+ Villa Market Dynamics: Villa Investment Appeal: Townhouse Market Segment Current Market Data (January 2026): Townhouse Type Size (Sq.Ft.) Price Range Price/Sq.Ft. Avg. Rental 2-Bedroom 2,000-2,500 AED 1.6-2.2M AED 720-900 AED 100-120K 3-Bedroom 2,500-3,500 AED 2.2-3.5M AED 750-950 AED 120-150K 4-Bedroom Luxury 3,500-4,500 AED 3.5-5.0M AED 800-1,100 AED 150-200K Townhouse Market Characteristics: Townhouse Investment Profile: Apartment Market Segment Current Market Data (January 2026): Apartment Type Size (Sq.Ft.) Price Range Price/Sq.Ft. Avg. Rental Rental Yield Studio 500-700 AED 450K-700K AED 800-1,100 AED 45-60K 8-9% 1-Bedroom 800-1,000 AED 700K-1.1M AED 850-1,200 AED 70-85K 8-9% 2-Bedroom 1,100-1,400 AED 1.2-1.8M AED 1,000-1,350 AED 100-130K 7.5-8.5% 3-Bedroom 1,500-2,000 AED 1.8-2.8M AED 1,100-1,450 AED 140-180K 7-8% Apartment Market Performance: Apartment Investment Advantages: Luxury Branded Residences Five Hotel Residences Property Overview: Unit Specifications: Unit Type Size Price Range Annual Rental 1-Bedroom 1,200-1,400 sq.ft. AED 1.8-2.4M AED 150-180K 2-Bedroom 1,800-2,200 sq.ft. AED 2.8-3.8M AED 220-280K 3-Bedroom 2,400-3,000 sq.ft. AED 3.8-5.2M AED 300-400K Premium Amenities: Investment Profile: Competitive Advantages: SECTION 4: COMPLETE AMENITIES OVERVIEW Retail & Shopping Circle Mall Dining Venues (40+): Restaurant Cuisine Location Type Sushi Do Japanese Circle Mall Casual Fine Dining Leila Lebanese Circle Mall Casual Broccoli Pizza & Pasta Italian Circle Mall Quick Bites McCafferty’s Irish Pub Pub Food Circle Mall Bar/Pub Village Bistro International First Collection All-Day Dining Sante Ria Latin-Inspired First Collection Rooftop Bar Trattoria by Cinque Italian Five Hotel Fine Dining Soul Street Gourmet Street Food Five Hotel Casual Goose Island Tap House Craft Beer/Sports Five Hotel Bar/Restaurant Retail Services: Hotels & Hospitality Five Hotel Jumeirah Village The First Collection at JVC (Tribute Portfolio Hotel) Hotel Occupancy Impact: Schools & Education Primary Education: Educational Features: Impact on Property Value: Healthcare Facilities Primary Healthcare: Healthcare Services: Access & Convenience: Sports & Recreation Sports Facilities: Sports Programs: Parks & Green Spaces (30+): Entertainment & Leisure Family Entertainment: Lifestyle Activities: Proximity to Dubai Attractions: SECTION 5: PRICING ANALYSIS WITH CURRENT MARKET DATA Market Overview (January 2026) Based on comprehensive data from Propertyfinder, Bayut, and Property Monitor, JVC represents exceptional value in Dubai’s real estate market. Key Pricing Metrics: Segment Average Price Price/Sq.Ft. vs. Dubai Avg. Trend Studio Apartment AED 550K AED 900-1,100 -78% ↑ 8% 1-Bed Apartment AED 900K AED 1,000-1,200 -79% ↑ 9% 2-Bed Apartment AED 1.6M AED 1,100-1,350 -81% ↑ 10% 3-Bed Apartment AED 2.3M AED 1,200-1,450 -81% ↑ 11% 2-Bed Townhouse AED 1.9M AED 750-950 -77% ↑ 12% 3-Bed Townhouse AED 2.8M AED 800-1,100 -79% ↑ 13% 4-Bed Villa AED 3.8M AED 800-1,100 -74% ↑ 15% 5-Bed Villa AED 5.5M AED 900-1,200 -76% ↑ 18% Comparative Community Analysis Price Per Sq.Ft. Comparison (January 2026): Community Avg. Price/Sq.Ft. Apartment Villa Market Position Downtown Dubai AED 3,200 Premium N/A Ultra-Luxury Dubai Marina AED 2,100 Upper-Luxury N/A Luxury Waterfront Business Bay AED 1,950 Upper-Luxury N/A Business/Luxury JBR (Jumeirah Beach) AED 1,850 Upper-Luxury N/A Beach Lifestyle Jumeirah Village Circle AED 1,461 Mid-Luxury Accessible-Luxury Value Leader Arabian Ranches AED 1,350 Luxury Villas Luxury Villas Premium Villas Emirates Living AED 1,400 Mixed Luxury Villas Family Villas International City AED 850-950 Budget N/A Ultra-Affordable JVC’s Unique Position: Rental Market Analysis Rental Demand Drivers: Rental Pricing by Unit Type (January 2026): Unit Type Annual Rent Monthly Rent Gross Yield Net Yield Studio AED 45-60K AED 4.5-6K 8-9% 7-8% 1-Bedroom AED 70-85K AED 6.5-8K 8-9% 7.5-8% 2-Bedroom AED 100-130K AED 9-12K 7.5-8.5% 6.5-7.5% 3-Bedroom AED 140-180K …

Dubai Real Estate Market Review 24-Apr-2026

DUBAI MARINA

A Comprehensive Real Estate Investment Report January 2026 EXECUTIVE SUMMARY Dubai Marina stands as one of the world’s most prestigious waterfront communities and a cornerstone of Dubai’s luxury real estate market. This comprehensive report provides institutional-grade analysis for discerning investors and end-users evaluating opportunities in this iconic development. Market Position & Key Metrics (January 2026) Strategic Location & Scale: Current Market Valuations: Investment Returns: Market Demand: SECTION 1: DEVELOPMENT HISTORY & CURRENT STATUS Vision & Creation (2003-2008) Dubai Marina represents one of the most ambitious urban waterfront developments ever conceived. Developed by Emaar Properties in partnership with international design firm Skidmore Owings and Merrill (SOM), the project transformed a barren 50-million-square-foot expanse into a vibrant metropolitan community. Development Timeline: Current Community Status (2026) Dubai Marina has evolved beyond a residential development into a fully integrated lifestyle hub. The community now encompasses: Market Maturity Assessment: Dubai Marina has transitioned from a growth phase to a stabilization and optimization phase, characterized by: Upcoming Developments 2025-2030 Marina Sands (Meraas Holding) Marina Gate Enhancement Project Sustainability & Smart Community Initiatives SECTION 2: ARCHITECTURAL EXCELLENCE & COMMUNITY DESIGN Master Planning Principles Dubai Marina exemplifies world-class urban design principles: Waterfront Integration: The community’s defining feature is its 3.5 km canal system with dual sea access. This design provides: Architectural Diversity: Unlike many developments with uniform tower design, Dubai Marina features architectural diversity: Iconic Structures & Architectural Significance Cayan Tower (The Twisted Tower) Marina Gate Princess Tower Time Place Tower Address Dubai Marina Urban Design Quality Metrics Walkability & Connectivity: Public Space Design: Sustainability Features: [1] SECTION 3: RESIDENTIAL PROPERTY SEGMENTS Segment Analysis: Property Types & Market Positioning Premium High-Rise Apartments Target Market: International investors, expatriate families, luxury end-users Price Range: AED 1.5M – 6M Typical Unit Specs: 1-3 bedrooms, 700-1,400 sqft Market Leaders: Investment Characteristics: Ultra-Luxury Penthouses & Branded Residences Target Market: Ultra-high-net-worth individuals, international buyers Price Range: AED 9M – 25M+ Typical Unit Specs: 3-5 bedrooms, 2,500-4,500 sqft Flagship Projects: Property Developer Bedrooms Price Range Key Features Cavalli Tower DAMAC 3-5 BR AED 16.2M – 79.6M Roberto Cavalli design, sea views, private pools Versace Residences DAMAC 3-4 BR AED 12M – 35M Gianni Versace finishes, branded luxury, lifestyle LIV Residences DAMAC 2-4 BR AED 8.5M – 28M Contemporary luxury, high-tech amenities Murjan Towers Emirates 2-3 BR AED 2.2M – 8M Marina views, established luxury brand Investment Characteristics: Serviced Residences & Hotel-Residences Target Market: Investors seeking hospitality revenue, luxury travelers Price Range: AED 8M – 25M+ Model: Hybrid residence-hotel with housekeeping, concierge services Notable Projects: Property Units Model Annual Service Charge ROI Potential Address Dubai Marina 200+ 5-star serviced AED 40,000-60,000 5-6% (guaranteed returns) Elite Residence 400+ 4-star serviced AED 25,000-35,000 6-7% (managed rentals) Murjan Tower 300+ 3-star serviced AED 18,000-28,000 7-8% (franchise model) Investor Advantage: Hotel operators provide active management and guaranteed returns, reducing landlord burden. SECTION 4: DETAILED BRANDED RESIDENCES WITH PRICING & ADVANTAGES Cavalli Tower: Roberto Cavalli Branded Residences Project Overview: Residential Configuration: Unit Type Built-up Area Price Range Price/Sqft Key Features 1-Bedroom 893-1,061 sqft AED 2.35M – 3.1M AED 2,600-3,464 City/marina views, modern finishes 2-Bedroom 1,307-1,442 sqft AED 3.8M – 4.2M AED 2,635-3,142 Dual exposure, larger terraces 3-Bedroom 3,942-3,955 sqft AED 16.2M – 12.8M AED 3,846-4,006 Palatial layouts, sea views, private pools 4-Bedroom Penthouse 6,175 sqft AED 25.2M – 25.6M AED 4,087-4,145 Duplex configuration, exclusive amenities 5-Bedroom Sky Loft 12,807 sqft AED 79.6M AED 6,214 Ultra-luxury, unmatched size and exclusivity Cavalli Tower Advantages: Investment Analysis: Capital Appreciation: Expected 8-12% annually during construction and 4-6% post-completion Rental Yield: 4-5% (ultra-luxury segment typically lower but stable) Target Buyer Profile: UHNW individuals, family offices, international investors seeking trophy assets Payment Terms: 15% upon booking | 85% upon completion Versace Residences: Gianni Versace Branded Living Project Overview: Unit Configuration: Unit Type Size Range Price Range Premium Features 2-Bedroom 1,200-1,400 sqft AED 8.5M – 12M Versace marble, designer fixtures, balconies 3-Bedroom 1,800-2,000 sqft AED 12M – 18M Multiple terraces, entertainment spaces, views 4-Bedroom 2,500-3,000 sqft AED 18M – 28M Palatial layouts, private elevators, servants’ quarters Penthouse 3,500+ sqft AED 28M – 45M Rooftop terraces, infinity pools, 360° views Versace Residences Advantages: Investment Case: Positioning: Ultra-luxury segment with limited competition Target Buyers: Fashion industry insiders, international collectors, family offices Capital Appreciation: 6-10% annually (brand-driven appreciation) Rental Market: Strong international demand, AED 15,000-25,000/month for 2BR units LIV Residences: Contemporary Ultra-Luxury Project Overview: Unit Portfolio: Unit Type Built-up Area Starting Price Standout Features 2-Bedroom 1,150-1,300 sqft AED 8.5M Open-plan design, smart home integration 3-Bedroom 1,700-2,000 sqft AED 12.5M Multiple terraces, home automation 4-Bedroom 2,400-2,800 sqft AED 18.5M Separate living zones, premium kitchens 5-Bedroom Penthouse 3,500-4,200 sqft AED 28M – 38M Rooftop gardens, infinity edge pools LIV Residences Competitive Advantages: Investment Profile: Target Demographic: Tech-savvy professionals, entrepreneurs, digital nomads Rental Market Position: Premium corporate rentals (AED 12,000-18,000/month for 2BR) Capital Appreciation: 5-7% annually (contemporary design value) Occupancy Rates: 85%+ due to premium positioning and corporate demand Traditional Luxury Segments Murjan Towers (Emirates Properties) Configuration Price Range Yield Investment Focus 1-Bedroom AED 1.5M – 2.5M 6-8% Entry-level luxury, strong yields 2-Bedroom AED 2.2M – 4M 5-7% Family units, stable appreciation Penthouse AED 6M – 10M 4-5% Premium holds, capital preservation Princess Tower (DAMAC) Configuration Price Range Yield Market Position 1-Bedroom AED 1.8M – 2.8M 6-7% High occupancy, prime location 2-Bedroom AED 2.8M – 4.5M 5-6% Long-term stability, growth 3+ Bedroom AED 5M – 9M 4-5% Capital appreciation focus SECTION 5: PRICING ANALYSIS WITH REAL MARKET DATA (JANUARY 2026) Current Market Pricing Data Sources: Propertyfinder, Property Monitor, Bayut (Official January 2026 Data) Market Price Ranges by Unit Type STUDIO APARTMENTS 1-BEDROOM APARTMENTS 2-BEDROOM APARTMENTS 3-BEDROOM APARTMENTS 4+ BEDROOM PENTHOUSES Branded Residence Premium Pricing Project Unit Type Average Price Premium vs. Standard Market Justification Cavalli Tower 2-BR AED 3.8M +18-22% Fashion brand, design exclusivity Versace Residences 2-BR AED 10.5M +25-30% Ultra-luxury, Italian craftsmanship LIV Residences 2-BR AED 9.2M +20-25% Smart home, contemporary design Standard Marina 2-BR AED 3.1M Baseline Market comparison Price Trends & Market Dynamics 2024-2026 Price Movement: Year-over-Year Growth by Segment …

Dubai Real Estate Weekly Market Analysis 20-Apr-2026

DUBAI CREEK HARBOUR

Comprehensive Real Estate Investment Report January 2026 Edition EXECUTIVE SUMMARY Market Overview Dubai Creek Harbour represents one of the Middle East’s most ambitious waterfront development projects, spanning 550 hectares—larger than the entire Downtown Dubai district. Developed by Emaar Properties, this master-planned community offers exceptional investment opportunities with current average prices at AED 2,445 per square foot (as of Q2 2025), up 6.3% from AED 2,300 at end of 2024[1]. Key Market Metrics (January 2026) Metric Value Performance Average Price per Sqft AED 2,445 +6.3% YoY Average Apartment Price AED 4,390,000 At national average Rental Yield – Apartments 5.5-6.8% Above Dubai average (5.45%) Rental Yield – Branded Units 6-8% Premium segment Capital Appreciation (2024-2025) 14.3% Strong growth Transaction Volume Growth +127-262% Record activity Ready Units Delivered 6,000-7,000 Phase 1 completion Total Future Units Planned 48,500 Multi-phase development Development Status Why Invest in Dubai Creek Harbour? Dubai Creek Harbour combines strategic location, world-class amenities, freehold ownership benefits, and exceptional growth potential. The development offers: 1. DEVELOPMENT HISTORY & CURRENT STATUS Project Overview Dubai Creek Harbour is a visionary mixed-use waterfront development masterplan positioned on the historic Dubai Creek. Developed by Emaar Properties, the project represents a new chapter in Dubai’s urban evolution, combining residential, commercial, cultural, and recreational elements within an integrated smart community framework [2]. Historical Timeline Period Milestone 2014-2017 Masterplan conception and regulatory approval 2017-2020 Infrastructure development, initial project launches 2020-2023 Phase 1 residential launches, commercial expansion 2023-2025 Major handovers, branded residence launches 2025-2027 Phase 2 & 3 launches (Beachfront, Savanna, Cedar, Lotus) 2029-2030 Full infrastructure completion, Blue Line Metro opening Current Development Status (January 2026) Completed Phases Approximately 20 residential projects have been delivered as of early 2025, with 6,000-7,000 units ready for immediate occupancy. These projects span multiple sub-communities including: Active Construction Multiple projects currently under construction with targeted delivery 2026-2027: Future Development Pipeline (2025-2030) Planned Projects Project Name Type Target Handover Status Beachfront Communities Low-rise apartments/townhouses 2025-2027 Planning Savanna at Creek Beach Family-focused residences 2026-2027 Approved Cedar at Creek Beach Waterfront apartments 2026-2027 Approved Lotus at Creek Beach Beach community 2025-2026 Active Dubai Creek Tower Iconic observation tower 2028-2029 Construction Dubai Square Mall Next-gen retail hub 2027-2028 Planning Cultural Venues Museums, galleries, theaters 2028-2030 Master planning Blue Line Metro Station | Transit Hub | 2029 | Construction       Table 1: Dubai Creek Harbour Development Pipeline 2025-2030 Infrastructure Completion 2. ARCHITECTURAL EXCELLENCE & COMMUNITY DESIGN Master Plan Concept Dubai Creek Harbour features an innovative 9-zone community design, each with distinct character while maintaining cohesive urban integration[3]: Architectural Philosophy The development emphasizes: Iconic Landmark: Dubai Creek Tower The centerpiece of Dubai Creek Harbour is the Dubai Creek Tower, a stunning 480-meter observation tower designed by world-renowned architect Santiago Calatrava. The tower features: Construction is ongoing, with expected completion 2028-2029, adding immense iconic value and visitor attraction to the community [4]. 3. RESIDENTIAL PROPERTY SEGMENTS Segment Overview Dubai Creek Harbour offers diverse residential options catering to various buyer profiles and investment strategies: Property Type Distribution Property Type Estimated % Target Market High-rise Apartments (1-3 BR) 45% Investors, young professionals, downsizers Mid-rise Apartments (2-3 BR) 25% Families, mix of owner-occupiers and investors Townhouses (3-4 BR) 15% Families seeking more space and privacy Villas (3-4+ BR) 10% Luxury segment, high-net-worth individuals Branded Residences 5% Premium investors, hotel-managed returns Table 2: Residential Property Type Distribution Standard Residential Units 1-Bedroom Apartments 2-Bedroom Apartments 3-Bedroom Apartments Townhouses Luxury Villa Segment Selected villa developments within Dubai Creek Harbour offer premium positioning: 4. BRANDED RESIDENCES – PREMIUM INVESTMENT OPTIONS Branded Residences Overview Dubai Creek Harbour features several world-renowned branded residence properties, offering hotel-managed returns and luxury amenities: LYVIA BY PALACE at Dubai Creek Harbour Project Highlights Lyvia by Palace represents a landmark branded residence collaboration between Emaar Properties and the world-famous Palace Hotels brand, bringing European luxury heritage to Dubai’s waterfront [5]. Property Specifications Unit Type Size (Sq Ft) Units Starting Price 1-Bedroom Apartment 755-1,417 120 AED 1,980,000 2-Bedroom Apartment 1,144-1,917 180 AED 2,920,000 3-Bedroom Apartment 1,821-1,835 48 AED 4,120,000 3-Bedroom Townhouse 3,238-3,245 9 AED 6,760,000 Table 3: Lyvia by Palace – Unit Types and Pricing Key Advantages Design Philosophy Lyvia by Palace features: Investment Potential VIDA RESIDENCES CREEK BEACH Project Highlights Vida Residences Creek Beach represents Emaar’s first beach-front branded residential tower, featuring the award-winning Vida Hotel design philosophy and direct beach access[6]. Property Specifications Unit Breakdown Distinctive Features Investment Advantages PALACE RESIDENCES at Dubai Creek Harbour Project Highlights Palace Dubai Creek Harbour represents the flagship branded residence tower, positioned as the iconic entry point for luxury living in the community. Property Specifications Premium Offerings Hotel-Managed Features Investment Profile 5. PRICING ANALYSIS – CURRENT MARKET DATA (JANUARY 2026) Market Pricing Overview Data Sources: Property Monitor (January 2026), Propertyfinder, Bayut, Dubai Land Department Dubai Creek Harbour pricing reflects a mature, active secondary market with ongoing new supply integration from Phase 2 and Phase 3 launches. Average Pricing by Property Type Property Type Average Price Price/Sqft Price Range 1-Bedroom Apartment AED 2,180,000 AED 2,580 AED 1.9M – 2.8M 2-Bedroom Apartment AED 3,420,000 AED 2,650 AED 2.8M – 4.2M 3-Bedroom Apartment AED 4,680,000 AED 2,720 AED 3.8M – 5.8M Townhouse (3-BR) AED 7,200,000 AED 2,400 AED 6.2M – 8.5M Villa (3-4 BR) AED 11,500,000 AED 2,200 AED 9M – 14M Table 4: Dubai Creek Harbour Average Pricing – January 2026 Pricing by Sub-Community Sub-Community Avg Price/Sqft Type Market Position Island District AED 2,750-3,100 Luxury apartments, penthouses Premium segment Creek Beach AED 2,600-2,900 Beach-front apartments Upper-mid market Green Gate AED 2,400-2,650 Mid-rise, branded residences Mid-market Creek Residences AED 2,550-2,800 High-rise apartments Upper-mid market Waterfront Communities AED 2,450-2,700 Mixed mid-rise Mid-market Table 5: Pricing by Sub-Community Location Pricing Trends (2024-2026) Market Performance: Strong capital appreciation of 14.3% over 12-month period, significantly outpacing Dubai average of 10.2%. Comparative Pricing Analysis Location Price/Sqft Rental Yield Position Dubai Creek Harbour AED 2,445 5.5-6.8% Value + growth Downtown Dubai AED 2,900-3,500 5.5-7.0% Premium, established Dubai Marina AED 2,700-3,200 5.5-6.5% Mature, stable Dubai Hills Estate AED 2,200-2,600 5.0-6.5% Family focus Business Bay AED …

DUBAI 2040 URBAN MASTER PLAN

DUBAI 2040

URBAN MASTER PLAN Real Estate Investment Opportunities & Comprehensive Market Analysis TABLE OF CONTENTS 1. EXECUTIVE SUMMARY Dubai’s 2040 Urban Master Plan represents one of the most ambitious urban transformation initiatives globally, positioning the emirate as the world’s premier destination for real estate investment. This comprehensive analysis examines the convergence of strategic urban planning, unprecedented millionaire migration, and luxury real estate development that creates exceptional opportunities for both investors and end-users. Key Highlights: 2. DUBAI 2040 URBAN MASTER PLAN OVERVIEW The Dubai 2040 Urban Master Plan, approved by His Highness Sheikh Mohammed bin Rashid Al Maktoum, sets forth a comprehensive vision to make Dubai the world’s best city to live in, work, and visit. This seventh master plan since 1960 integrates all urban development initiatives with Dubai’s strategic economic priorities. 2.1 Five Urban Centers Strategy The plan designates five primary urban centers, each serving distinct economic and social functions: 2.2 Key Objectives 3. MILLIONAIRE MIGRATION & POPULATION DYNAMICS 3.1 Record-Breaking HNWI Influx Dubai has emerged as the world’s top destination for millionaire migration, attracting an unprecedented 9,800 High-Net-Worth Individuals (HNWIs) in 2025 alone. This represents the highest global inflow, surpassing traditional wealth hubs including London, Singapore, and New York. Key Migration Statistics: Primary Source Countries: 3.2 Economic Impact The millionaire migration directly fuels luxury real estate demand: 4. LUXURY & ULTRA-LUXURY REAL ESTATE DEVELOPMENTS 4.1 Market Leadership Position Dubai has established itself as the global leader in ultra-luxury real estate transactions. In 2024, the emirate recorded 435 property sales exceeding USD 10 million, the highest volume globally – surpassing traditional luxury markets including London, New York, Hong Kong, and Singapore. Market Highlights: 4.2 Billionaires’ Row – Palm Jumeirah Frond G Palm Jumeirah’s Frond G has emerged as the world’s third-most prestigious billionaire enclave, following Monaco and Beverly Hills. Key Features: 4.3 Branded Residences Dubai leads globally in branded residence developments, offering unparalleled luxury lifestyle integrated with world-class hospitality brands. Bulgari Residences – Jumeirah Bay Island: Armani Residences – Burj Khalifa: Bugatti Residences – Business Bay: 4.4 Emirates Hills – Dubai’s Beverly Hills Emirates Hills represents Dubai’s most exclusive gated community, comparable to Beverly Hills and featuring 36-hole golf course living. Market Overview: 5. MARKET PERFORMANCE & DEVELOPMENT PIPELINE 5.1 2025 Market Performance Dubai’s real estate market achieved record-breaking performance in the first half of 2025: Transaction Volume: • Total sales value: AED 559.4 billion (H1 2025) • Number of transactions: 97,325 deals • Average transaction size: AED 5.75 million • Year-over-year growth: 23.4% New Launches: 5.2 Development Pipeline 2025-2040 To accommodate population growth from 3.3 million to 5.8 million, Dubai requires 505,000-600,000 new residential units through 2040. Delivery Timeline: 2025-2030 (Phase 1): 2031-2035 (Phase 2): 2036-2040 (Phase 3): 6. INFRASTRUCTURE & CONNECTIVITY 6.1 Dubai Metro Blue Line The AED 20.5 billion Dubai Metro Blue Line represents a transformative infrastructure investment, directly enhancing property values and accessibility. Project Specifications: Economic Impact: 6.2 20-Minute City Concept The master plan implements a 20-minute city concept, ensuring residents can access daily needs within 20 minutes using sustainable transport:   7. INVESTMENT ADVANTAGES 7.1 Financial Benefits Dubai offers unparalleled investment advantages combining capital appreciation, rental yields, and tax benefits: Capital Appreciation: Rental Yields: Tax Advantages: 7.2 Strategic Location Benefits Prime Investment Zones: 1. Palm Jumeirah/Billionaires’ Row    – Ultra-luxury positioning    – Limited supply driving scarcity value    – International prestige address 2. Dubai Creek Harbour    – 6 square kilometers mega-development    – Dubai Creek Tower (future world’s tallest)    – Waterfront living at competitive pricing 3. Business Bay/DIFC    – Financial district proximity    – High rental demand from professionals    – Proven appreciation track record 4. Mohammed Bin Rashid City    – Master-planned community    – Green spaces and lifestyle amenities    – Family-oriented with strong rental demand   8. END-USER BENEFITS 8.1 Quality of Life Enhancements The Dubai 2040 master plan prioritizes resident wellbeing through comprehensive lifestyle improvements: Green Spaces & Recreation: Education & Healthcare: 8.2 Accessibility & Connectivity 8.3 Affordability Programs   9. MARKET OUTLOOK & PROJECTIONS 9.1 Growth Projections Through 2040 Luxury Segment Forecast: Mid-Market Segment: 9.2 Risk Factors & Mitigation Market Risks: Mitigation Strategies: 9.3 Investment Thesis Summary Dubai’s real estate market presents a compelling investment opportunity driven by: CONCLUSION Dubai’s 2040 Urban Master Plan creates an unprecedented convergence of factors that position the emirate as the premier global destination for real estate investment. The combination of strategic government planning, record-breaking millionaire migration, world-class infrastructure development, and proven market performance creates compelling opportunities across all segments. For investors, the market offers 15-18% annual returns in prime locations, combined with 5.5-9% rental yields and comprehensive tax advantages. The ultra-luxury segment, driven by 9,800 annual HNWI arrivals bringing AED 231 billion in capital, demonstrates sustained demand for premium properties in locations like Billionaires’ Row, Emirates Hills, and branded residences. For end-users, the master plan delivers enhanced quality of life through 105% expansion of green spaces, comprehensive public transport (131 km metro network), and the innovative 20-minute city concept ensuring accessibility to all daily needs. The development pipeline of 505,000-600,000 units through 2040, aligned with population growth to 5.8 million residents, demonstrates balanced supply-demand dynamics with strategic emphasis on luxury and ultra-luxury segments where demand significantly exceeds supply. Dubai 2040 is not merely an urban development plan—it represents a comprehensive vision for creating the world’s best city to live in, work, and invest. The convergence of visionary leadership, strategic execution, and global appeal positions Dubai’s real estate market for sustained long-term growth through 2040 and beyond.

DUBAI SOUTH: Comprehensive Real Estate Investment Report

DUBAI SOUTH: Comprehensive Real Estate Investment Report

Prepared: November 2025 TABLE OF CONTENTS 1. EXECUTIVE SUMMARY Dubai South represents one of the most ambitious urban development projects in the UAE and globally. Spanning 145 square kilometers (equivalent to 40% of Dubai’s land area), this master-planned city is strategically positioned to become a major economic and residential hub. Figure 1: Aerial view of Dubai South master plan showcasing the extensive urban development Key Highlights Investment Opportunity Dubai South presents a golden window for investors seeking high rental yields, strong capital appreciation, and strategic positioning in Dubai’s southward expansion. With the Al Maktoum Airport expansion (AED 128 billion), Dubai Metro Blue Line extension, and Etihad Rail connectivity, the area is poised for exponential growth. 2. OVERVIEW OF DUBAI SOUTH Formerly Known As: Dubai World CentralLaunched: 2006Size: 145 square kilometersLocation: Southern Dubai, adjacent to Al Maktoum International Airport Figure 2: Al Maktoum International Airport – the centerpiece of Dubai South development Dubai South is Dubai’s largest single urban master development focusing on an aviation and logistics ecosystem. The development aims to create a vibrant living and working community that leverages its unique aviation, logistics, and real-estate products and services with world-class infrastructure. Strategic Positioning Dubai South is strategically located halfway between Dubai and Abu Dhabi, providing excellent connectivity to both emirates. The development is part of the Dubai 2040 Urban Master Plan and aligns with the Dubai Economic Agenda D33. Vision To create a self-sustained city within Dubai where people can live, work, and invest in a healthy and happy environment. The development incorporates smart city technology, sustainable design principles, and extensive green spaces. 3. MASTER PLAN AND DISTRICTS Dubai South features eight integrated districts connected with smart infrastructure: 1. Aviation District Figure 3: Futuristic terminal design for Al Maktoum International Airport expansion 2. Logistics District 3. Residential District Figure 4: Modern residential community in Dubai South with extensive amenities 4. Golf District Figure 5: Premium golf course at Emaar South with luxury residential buildings 5. Commercial District 6. Expo City Dubai Figure 6: Iconic Expo 2020 site now transformed into Expo City Dubai Figure 7: Innovative solar panel structures at Expo City Dubai demonstrating sustainability commitment 7. Dubai South Free Zone 8. Entertainment and Leisure 4. MAJOR DEVELOPMENTS Completed and Ongoing Projects 1. Emaar South Figure 8: Luxury residential units at Emaar South overlooking the championship golf course Figure 9: Wide open golf course views at Golf Links, Emaar South 2. The Pulse 3. MAG 5 Boulevard 4. South Bay 5. Discovery Dunes Golf Club 6. Expo City Dubai (Expo Living) 7. Other Residential Communities Figure 10: Detailed map of Dubai South residential communities and key infrastructure 5. MAJOR PROPERTY DEVELOPERS IN DUBAI SOUTH 1. Emaar Properties 2. Dubai South Properties 3. MAG Lifestyle Development 4. Discovery Land Company 5. BT Holding LLC 6-10. Other Active Developers Azizi Developments, Sobha Realty, Damac Properties, Al Habtoor Group, Meraas, H&H Development, Mira Developments, Tristar Engineering & Construction, and Arabtec all maintain active development portfolios in Dubai South. 6. INVESTMENT ANALYSIS Market Performance Property Prices (from DXBInteract data) Figure 11: Property type distribution by price range in Dubai South Price Trends and Projections Figure 12: Historical price performance and future projections for Dubai South showing 20% historical growth and projected 15-20% appreciation Rental Yields Figure 13: Dubai South offers superior rental yields (6.8%) compared to established Dubai neighborhoods Price Appreciation Transaction Volume Figure 14: Strong and accelerating transaction volumes demonstrating sustained market confidence ROI Analysis Figure 15: Comprehensive ROI breakdown showing total returns of 35% over 3 years and 54% over 5 years Investor Profile Suitability Favorable Market Conditions 1. Price Correction Phase 2. Infrastructure Development 3. Job Creation 4. Population Growth 7. AMENITIES AND INFRASTRUCTURE Residential Amenities 1. Parks and Green Spaces 2. Sports and Recreation 3. Education 4. Healthcare 5. Retail and Dining 6. Entertainment 7. Places of Worship 8. Community Facilities Smart Infrastructure 1. Utilities 2. Security 3. Parking 8. TRANSPORTATION AND CONNECTIVITY Air Connectivity Figure 16: Current operations at Al Maktoum International Airport with extensive aircraft parking Road Network Public Transportation (Upcoming) 1. Dubai Metro Blue Line Figure 17: Dubai Metro Blue Line extension route connecting Dubai South to the wider network Figure 18: Complete Dubai Metro system including the Blue Line integration 2. Etihad Rail 3. Bus Services Proximity to Key Locations Multi-Modal Transport Hub Dubai South’s strategic positioning creates a unique multi-modal transport ecosystem combining air, land, and sea connectivity through Al Maktoum Airport, Jebel Ali Port, and road/rail networks. 9. FUTURE PLANS AND VISION 2030 Al Maktoum International Airport Expansion Dubai 2040 Urban Master Plan Alignment Dubai Economic Agenda D33 Planned Developments 1. Residential Expansion 2. Commercial Growth 3. Infrastructure Enhancement 4. Expo City Evolution 5. Golf District Expansion 6. Free Zone Growth Sustainability Goals Long-Term Vision Dubai South aims to transform into a completely self-sustained, smart city that serves as a model for urban development globally. The integration of aviation, logistics, residential, and commercial elements creates a unique ecosystem that will drive Dubai’s economy for decades. 10. ADVANTAGES FOR INVESTORS 1. Strategic Location 2. High Rental Yields 3. Strong Capital Appreciation 4. Affordable Entry Point 5. Government-Backed Development 6. Free Zone Benefits 7. Diverse Investment Options 8. UAE Residence Visa Eligibility 9. Payment Plans 11. ADVANTAGES FOR END USERS 1. Affordable Living 2. Airport Proximity 3. Quality of Life 4. Complete Amenities 5. Self-Sustained Community 6. Modern Smart Homes 7. Future Growth Potential 12. MARKET TRENDS AND STATISTICS Dubai Real Estate Market (2024-2025) Dubai South Specific Data Price Trends Rental Market Supply Pipeline Demand Drivers Comparative Analysis Dubai South offers: Investor Profile 13. RECOMMENDATIONS For Investors 1. Timing STRONG BUY RECOMMENDATION 2. Property Type Recommendations Budget-Conscious Investors (AED 450K-800K): Mid-Range Investors (AED 800K-2M): High-Net-Worth Investors (AED 3M+): 3. Strategic Considerations 4. Due Diligence For End Users 1. Ideal Profile 2. Lifestyle Recommendations Families: Young Professionals: Retires: 3. Considerations Risk Factors to Consider 1. Development Timeline 2. Market Volatility 3. Location Perception Mitigation Strategies CONCLUSION Dubai South represents a once-in-a-generation investment opportunity in Dubai’s …