

- April 21, 2026
- 3
- News&Media
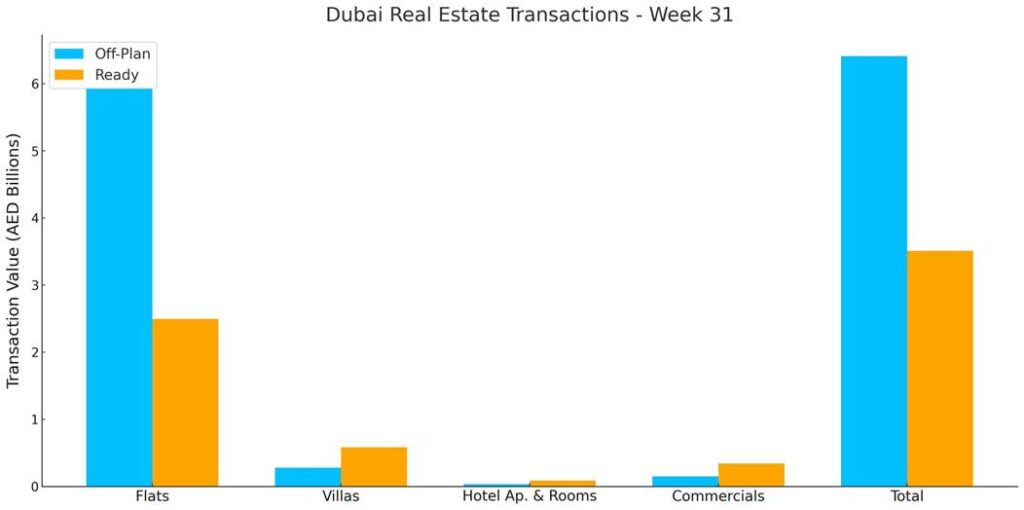
The total real estate transactions in Dubai for Week 31 was AED 9.92 billion and 4,543 transactions. Off-plan contributed 64.6% or 6.41 billion, while Ready properties contributed 35.4% or 3.51 billion.
On the 31st week of 2025, Dubai’s property market tallied AED 9.92 billion in transaction value across 4,543 deals this week, a 2.1 % drop in value and -7.2 % in deal count versus last week (AED 10.14 billion, 4,894 deals). Off-plan activity continued to dominate, accounting for 64.6 % of total value, while ready assets contributed 35.4 %.
| Sub-Category | Off-Plan (AED million) | Ready (AED million) |
| Flat | 5,944.9 | 2,499.0 |
| Villa | 278.3 | 581.3 |
| Hotel Apts & Rooms | 35.6 | 87.0 |
| Commercials | 150.9 | 344.4 |
| Total | 6,409.6 | 3,511.7 |
Off-Plan Market Performance
- Total Value: AED 6.41 billion
- Share of Total Value: 64.6 %
| Sub-category | Value (AED million) | % of Off-Plan |
| Flats | 5,944.9 | 92.7 % |
| Villas | 278.3 | 4.3 % |
| Hotel Apts & Rooms | 35.6 | 0.6 % |
| Commercial | 150.9 | 2.4 % |
Flats remained the clear growth engine, capturing more than ninety percent of the segments spend.
Top Performing Off-Plan Areas (by Value Traded)
| Area | Value (AED million) |
| Wadi Al Safa 4 | 574.3 |
| Zaabeel Second | 542.7 |
| Bukadra | 413.4 |
| Jumeirah Second | 407.5 |
| Business Bay | 331.6 |
The top 10 communities amassed AED 3.50 billion, roughly 54.6 % of all off-plan spend this week, led by sales in Wadi Al Safa 4 and Zaabeel Second.
Ready Market Performance
- Total Value: AED 3.51 billion
- Share of Total Value: 35.4 %
| Sub-category | Value (AED million) | % of Ready |
| Flats | 2,499.0 | 71.1 % |
| Villas | 581.3 | 16.6 % |
| Hotel Apts & Rooms | 87.0 | 2.5 % |
| Commercial | 344.4 | 9.8 % |
Apartment resales continued to underpin the ready market, though villa liquidity held firm above a 16 % share.
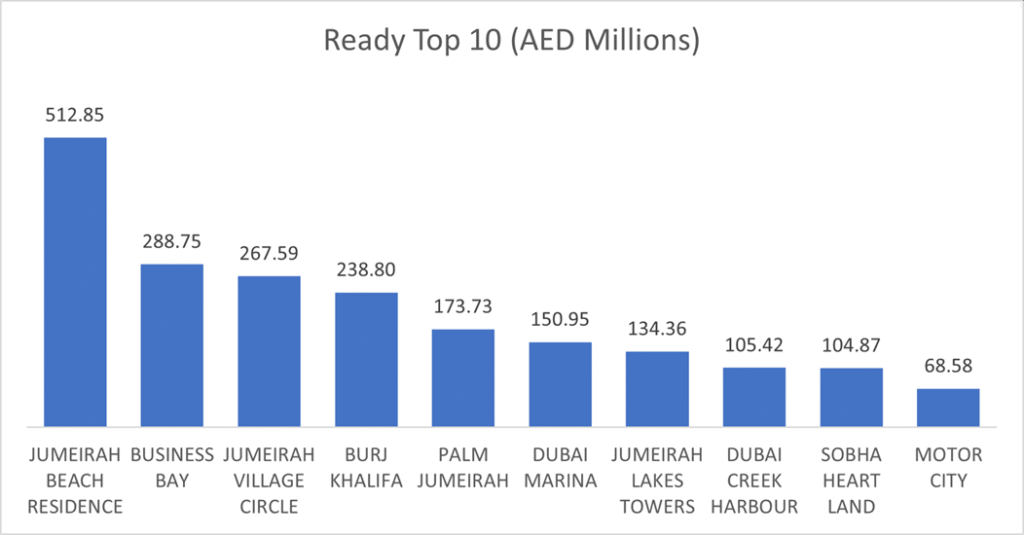
Top Performing Ready Areas (by Value Traded)
| Area | Value (AED million) |
| Jumeirah Beach Residence | 512.8 |
| Business Bay | 288.7 |
| Jumeirah Village Circle | 267.6 |
| Burj Khalifa | 238.8 |
| Palm Jumeirah | 173.7 |
The top 10 ready hotspots generated AED 2.05 billion, representing 58.3 % of all ready spend, with coastal and established mixed-use districts dominating demand.
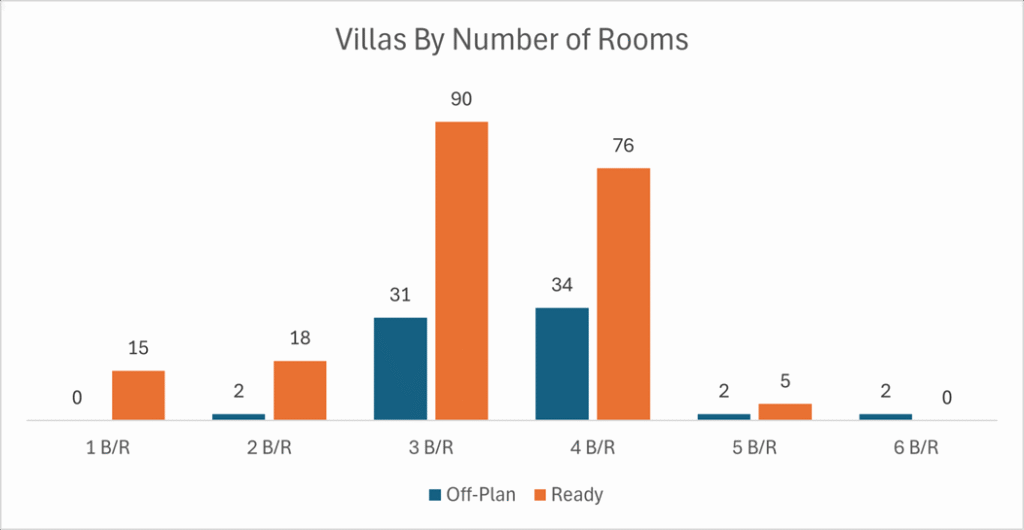
On the micro level, below is the sales distribution based on the number of bedrooms
Weekly Comparison
| Metric | Week 30 | Week 31 | Change |
| Total Volume | AED 10.14 bn | AED 9.92 bn | -2.1 % |
| Transactions | 4,894 | 4,543 | -7.2 % |
Market Insights & Outlook
- Resilient Off-Plan Demand: Despite a softer headline week, off-plan volumes stayed above the AED 6 billion mark as buyers chase early-stage pricing.
- Ready Market Rotation: JBR sales surge and securing the number 1 spot in value traded was due to the sale of 1 building for AED 471 million.
- Liquidity Drift: A drop in transaction count outpaced value erosion, implying larger ticket sizes, particularly in prime off-plan launches, are cushioning turnover.
Overall, Week 31 underscores Dubai’s deep capital pool and buyers’ willingness to commit early where compelling masterplans align with lifestyle demand.