

Dubai Real Estate Weekly Market Analysis 29-Dec-2025
- December 29, 2025
- 126
- News&Media
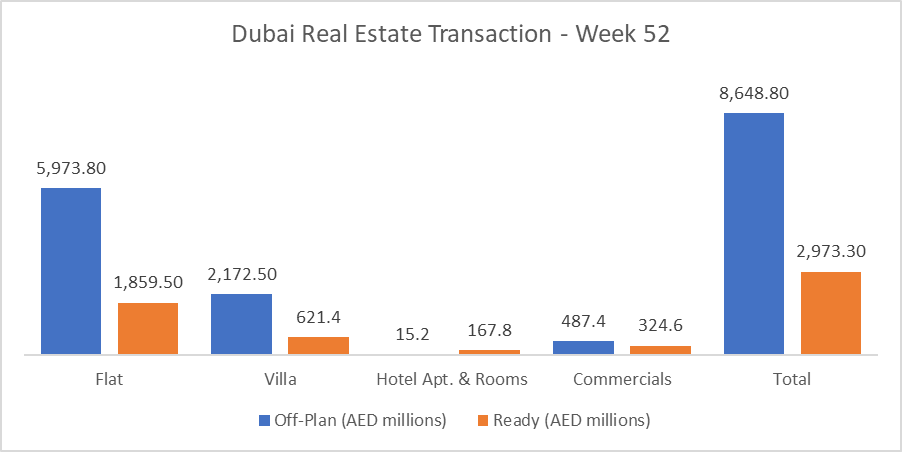
The total real estate transactions in Dubai for Week 52 was AED 11.62 billion and 5,468 transactions. Off-Plan contributed 74.4% or 8.65 billion, while Ready properties contributed 25.6% or 2.97 billion.
Total trading in Week 52 reached AED 11.62B across 5,468 transactions. Off-Plan dominated with AED 8.65B (74.4%), while Ready accounted for AED 2.97B (25.6%). Versus last week (AED 10.0B, 4,721 transactions), value traded increased by AED 1.66B (16.7%) and transactions increased by 747 (15.8%).
| Category | Off-Plan (AED millions) | Ready (AED millions) |
| Flat | 5,973.8 | 1,859.5 |
| Villa | 2,172.5 | 621.4 |
| Hotel Apt. & Rooms | 15.2 | 167.8 |
| Commercials | 487.4 | 324.6 |
| Total | 8,648.8 | 2,973.3 |
Off-Plan Market Performance
Total Value: AED 8.65bn
Share of Weekly Total: 74.4%
| Category | Value | % of Off-Plan |
| Flat | AED 5.97bn | 69.1% |
| Villa | AED 2.17bn | 25.1% |
| Hotel Apt. & Rooms | 15.2m | 0.2% |
| Commercials | 487.4m | 5.6% |
Off-plan value was flat-led, with villas contributing a meaningful 25% share, reinforcing continued depth in larger-ticket new supply.
Top Performing Off-Plan Areas
| Area | Value | % of Off-Plan | % of Weekly Total |
| DIP Second | AED 1.63bn | 18.8% | 14.0% |
| Business Bay | 617.8m | 7.1% | 5.3% |
| Majan | 515.0m | 6.0% | 4.4% |
| Madinat Al Mataar | 380.3m | 4.4% | 3.3% |
| JVC | 363.9m | 4.2% | 3.1% |
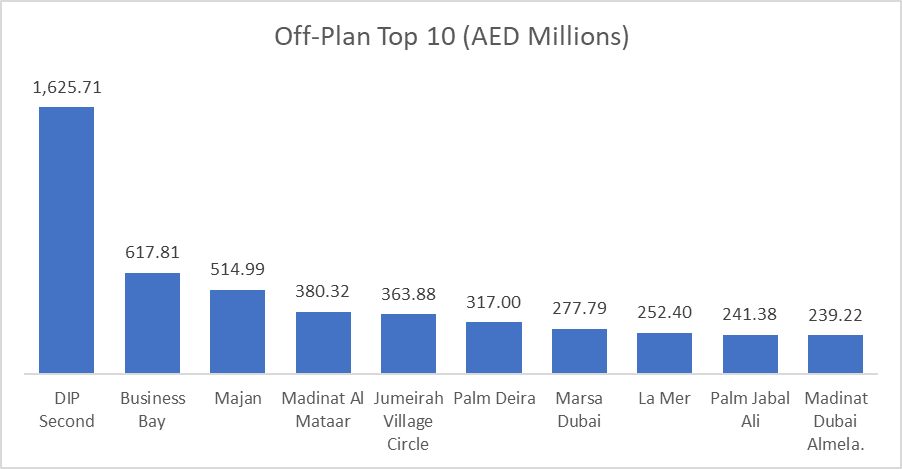
The top 10 off-plan areas traded AED 4.83bn, representing 55.9% of off-plan value (and 41.6% of total weekly trading), led by DIP Second.
Ready Market Performance
Total Value: AED 2.97bn
Share of Weekly Total: 25.6%
| Category | Value | % of Ready |
| Flat | AED 1.86bn | 62.5% |
| Villa | 621.4m | 20.9% |
| Hotel Apt. & Rooms | 167.8m | 5.6% |
| Commercials | 324.6m | 10.9% |
The ready segment stayed apartment-heavy, but with a stronger commercial share than off-plan, pointing to more diverse end-user and investment activity in completed stock.
Top Performing Ready Areas
| Area | Value | % of Ready | % of Weekly Total |
| Burj Khalifa | 226.2m | 7.6% | 1.9% |
| Business Bay | 212.7m | 7.2% | 1.8% |
| JLT | 166.9m | 5.6% | 1.4% |
| JVC | 161.1m | 5.4% | 1.4% |
| Dubai Marina | 147.2m | 4.9% | 1.3% |
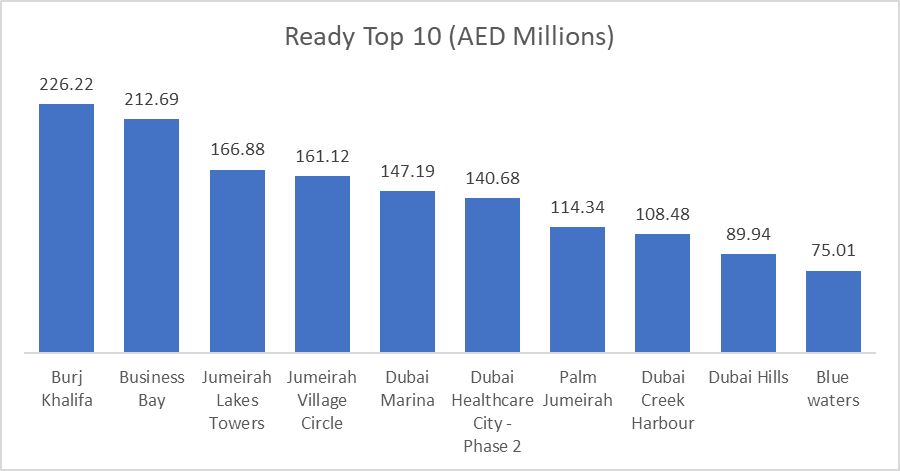
The top 10 ready areas traded AED 1.44bn, accounting for 48.5% of ready value (and 12.4% of total weekly trading), with prime locations (Burj Khalifa, Business Bay, Dubai Marina) leading
On the Micro Level
Weekly Comparison
| Metric | Last Week | This Week | Change |
| Total Volume | AED 9.96bn | AED 11.62bn | AED 1.66bn (16.7%) |
| Total Transactions | 4,721 | 5,468 | 747 (15.8%) |
Market Insights & Outlook
This week delivered a clear acceleration versus last week, with both value (+16.7%) and deal count (+15.8%) higher. The headline story remains off-plan concentration, not only in category mix (flats + villas), but also geographically, where the top 10 areas alone captured over half of off-plan value. Meanwhile, the ready market showed broad, liquid demand across core districts, supporting overall market depth as activity moves into the new year.
Data Source: Dubai Land Department