

- April 21, 2026
- 4
- News&Media
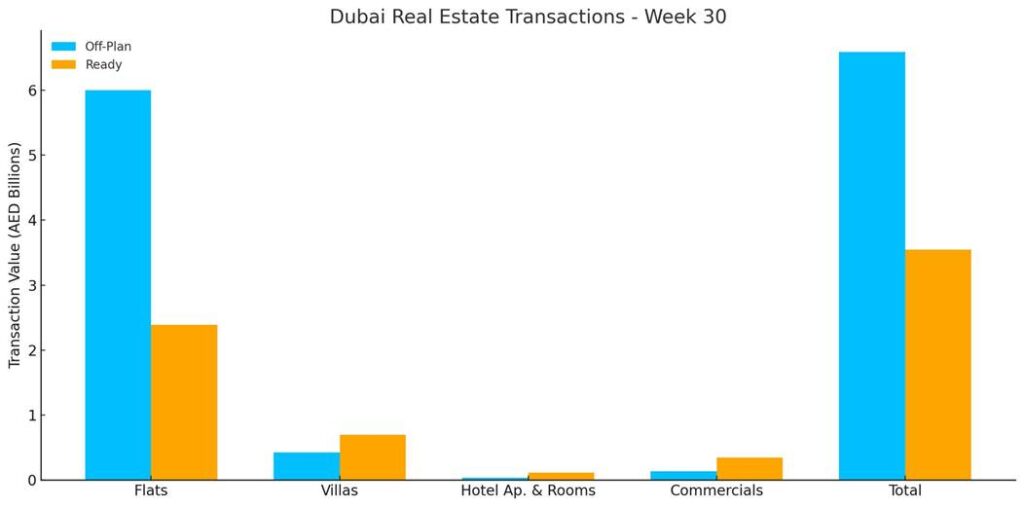
The total real estate transactions in Dubai for Week 30 was AED 10.14 billion and 4,894 transactions. Off-plan contributed 65.0% or 6.59 billion, while Ready properties contributed 35.0% or 3.55 billion.
Dubai’s property market generated AED 10.14 billion this week, a 24.2 % jump from last week’s AED 8.16 billion. The number of deals was 4,894, indicating that the higher turnover came from larger-ticket transactions rather than higher activity levels. Off-plan sales continued to dominate by value, but ready homes also posted strong gains.
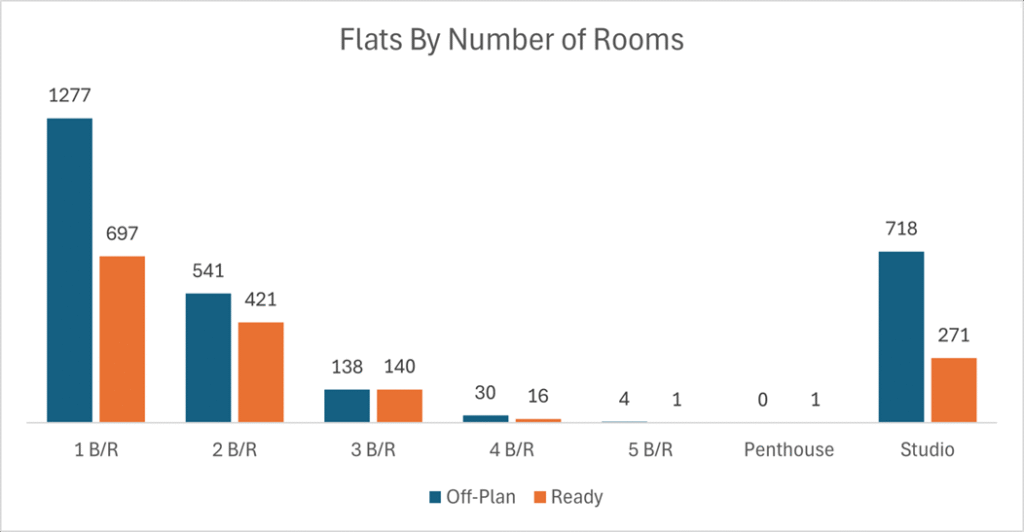
- 1-Beroom Flats were the most traded, with 1,974 transactions.
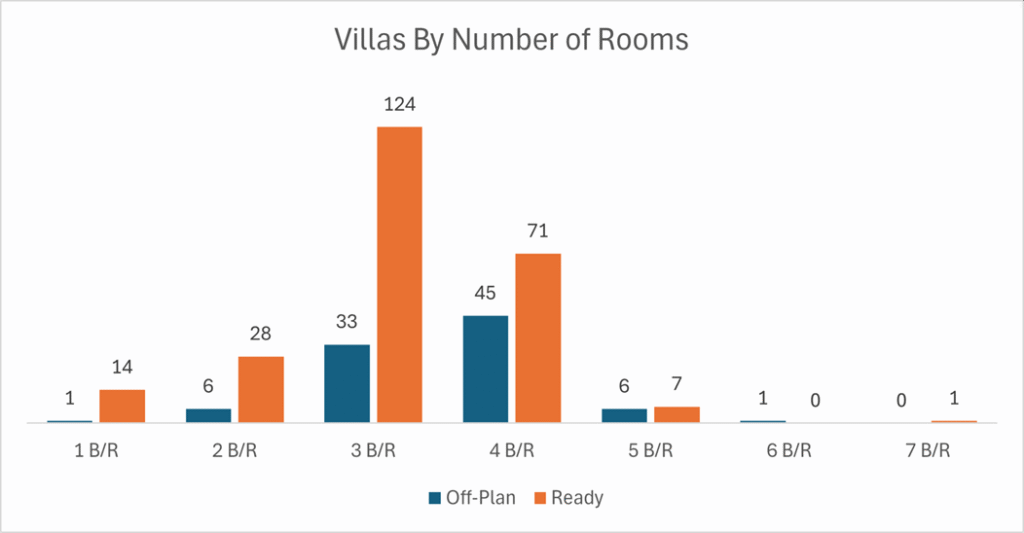
- 3-Bedroom & 4-Bedroom villas dominated the villas with 273 transactions combined.
- The total number of flats traded reached 4,255, while the villas accounted for 337 villas.
| Category | Off-Plan (AED millions) | Ready (AED millions) |
| Flat | 5 998.5 | 2 387.6 |
| Villa | 425.1 | 698.9 |
| Hotel Apt. & Rooms | 34.9 | 115.0 |
| Commercials | 132.5 | 344.2 |
| Total | 6 591.1 | 3 545.8 |
Off-Plan Market Performance
- Total Value: AED 6.59 billion
- Share of Total Value: 65.0 %
Subcategory Breakdown
| Sub-category | Value (AED millions) | % of Off-Plan |
| Flats | 5,998.5 | 91.0 % |
| Villas | 425.1 | 6.5 % |
| Hotel Apt. & Rooms | 34.9 | 0.5 % |
| Commercial | 132.5 | 2.0 % |
Apartment sales once again powered the off-plan segment, accounting for more than 90% of the total value traded.
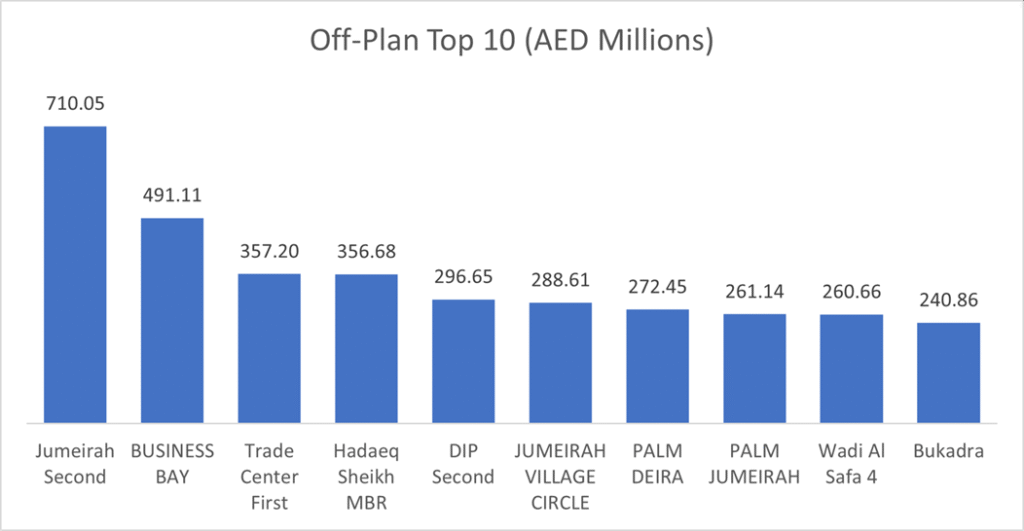
Top Performing Off-Plan Areas (by Value Traded)
| Area | Value (AED millions) |
| Jumeirah Second | 710.1 |
| Business Bay | 491.1 |
| Trade Center First | 357.2 |
| Hadaeq Sheikh MBR | 356.7 |
| DIP Second | 296.6 |
The top 10 districts captured AED 3.54 billion, or 53.6 % of all off-plan spending.
Ready Market Performance
- Total Value: AED 3.55 billion
- Share of Total Value: 35.0 %
Subcategory Breakdown
| Sub-category | Value (AED millions) | % of Ready |
| Flats | 2,387.6 | 67.3 % |
| Villas | 698.9 | 19.7 % |
| Hotel Apt. & Rooms | 115.0 | 3.2 % |
| Commercial | 344.2 | 9.7 % |
Secondary-market apartments remained the market movers, but villas claimed a healthy one-fifth of ready turnover.
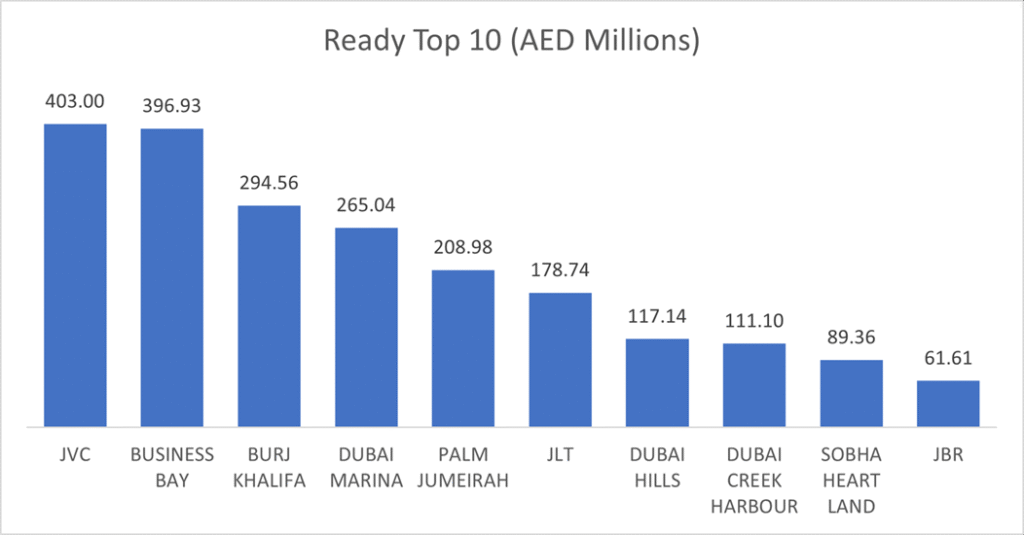
Top Performing Ready Areas (by Value Traded)
| Area | Value (AED millions) |
| Jumeirah Village Circle (JVC) | 403.0 |
| Business Bay | 396.9 |
| Burj Khalifa | 294.6 |
| Dubai Marina | 265.0 |
| Palm Jumeirah | 209.0 |
The top 10 districts together delivered AED 2.13 billion, or 59.9 % of ready trading.
On the micro level, below is the sales distribution based on the number of bedrooms
Weekly Comparison
| Metric | Week 29 | Week 30 | Change |
| Total Volume | AED 8.16 bn | AED 10.14 bn | +24.2 % |
| Transactions | 4,424 | 4,894 | 10.6 % |
Market Insights
- Larger deal sizes: With turnover up sharply while deal count stayed flat, average ticket sizes rose to about AED 2.07 million from AED 1.67 million a week earlier.
- Sustained appetite for new stock: Off-plan’s two-third share of spend underscores buyer confidence in upcoming launches and flexible payment plans.
- Geographic concentration: Business Bay featured in the top list for both segments, highlighting its broad appeal, while JVC and Jumeirah Second showed momentum.
- Ready villa resilience: Nearly AED 700 million in ready villa trades points to continued end-user and investor demand for established communities.