

- April 22, 2026
- 3
- News&Media
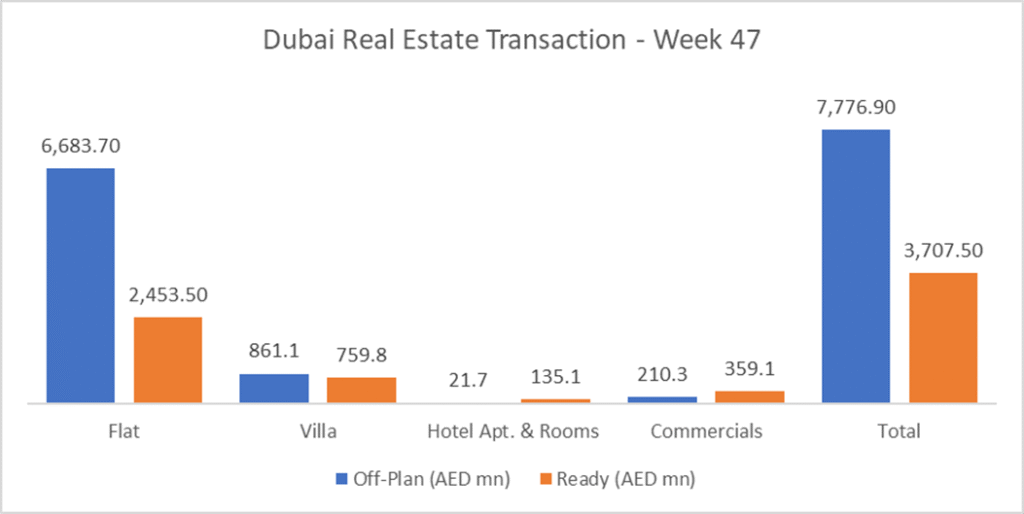
The total real estate transactions in Dubai for Week 47 was AED 11.48 billion and 5,284 transactions. Off plan contributed 67.7% or 7.78 billion, while Ready properties contributed 32.3% or 3.71 billion.
Total trading in Week 47 reached AED 11.48 billion across 5,284 registered transactions, up from AED 11.19 billion and 5,160 deals last week.
Off plan continued to dominate with AED 7.78 billion (67.7% of weekly value), while ready accounted for AED 3.71 billion (32.3%).
| Category | Off-Plan (AED mn) | Ready (AED mn) |
| Flat | 6,683.7 | 2,453.5 |
| Villa | 861.1 | 759.8 |
| Hotel Apt. & Rooms | 21.7 | 135.1 |
| Commercials | 210.3 | 359.1 |
| Total | 7,776.9 | 3,707.5 |
Off-Plan Market Performance
Total Value: AED 7.78 billion
Share of Weekly Total: 67.7%
- Flats: AED 6.68 billion (85.9% of off-plan)
- Villas: AED 0.86 billion (11.1% of off-plan)
- Hotel Apt. & Rooms: AED 0.02 billion (0.3% of off-plan)
- Commercials: AED 0.21 billion (2.7% of off-plan)
Off-plan activity remains overwhelmingly flat-led, with apartments capturing nearly nine out of every ten dirhams spent in the segment, while villas add a meaningful but much smaller share.
Top Performing Off-Plan Areas
| Area | Value (AED mn) | % of Off-Plan |
| Madinat Al Mataar | 783.9 | 10.1% |
| Palm Deira | 600.3 | 7.7% |
| Jumeirah First | 593.7 | 7.6% |
| Business Bay | 455.4 | 5.9% |
| Dubai Maritime City | 399.3 | 5.1% |
More than half of all off-plan value (53.8%) is concentrated in these ten locations, with Madinat Al Mataar, Palm Deira (Deira Islands) and Jumeirah First emerging as the key off-plan hotspots of the week.
Ready Market Performance
Total Value: AED 3.71 billion, representing 32.3% of the week’s traded value.
Share of Weekly Total: 32.3%
- Flats: AED 2.45 billion (66.2% of ready)
- Villas: AED 0.76 billion (20.5% of ready)
- Hotel Apt. & Rooms: AED 0.14 billion (3.6% of ready)
- Commercials: AED 0.36 billion (9.7% of ready)
The ready segment is also flat-driven, but with a more balanced profile: villas, hospitality assets and commercial properties together account for roughly one-third of ready activity, reflecting healthy end-user and income-focused demand.
Top Performing Ready Areas
| Area | Value (AED mn) | % of Ready |
| Burj Khalifa | 459.7 | 12.4% |
| Palm Jumeirah | 338.0 | 9.1% |
| Business Bay | 282.3 | 7.6% |
| Dubai Marina | 230.7 | 6.2% |
| Jumeirah Village Circle | 179.0 | 4.8% |
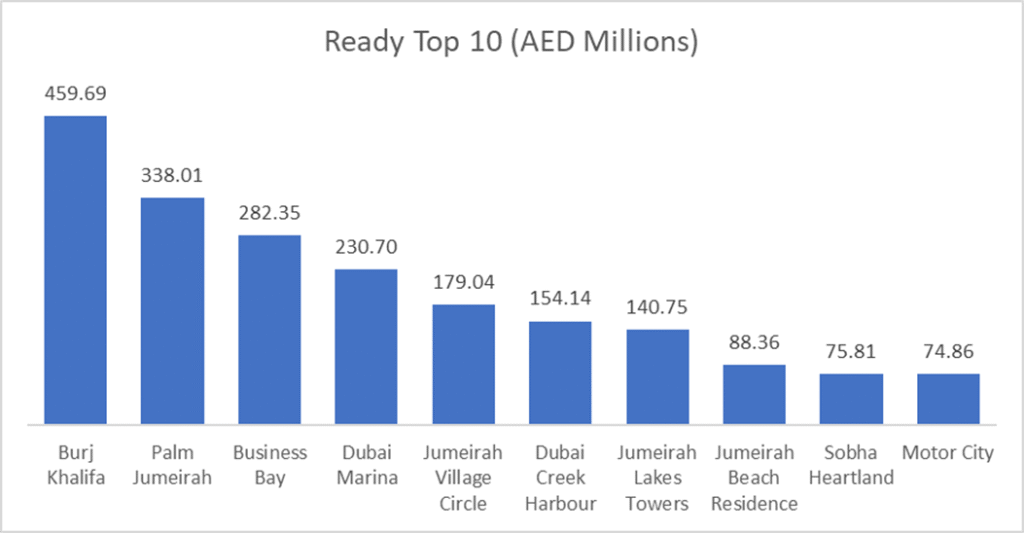
Just over half of ready activity (54.6%) is captured by these prime and established locations, with Burj Khalifa, Palm Jumeirah, Business Bay and Dubai Marina reinforcing their position as the core of Dubai’s ready resale and handover market.
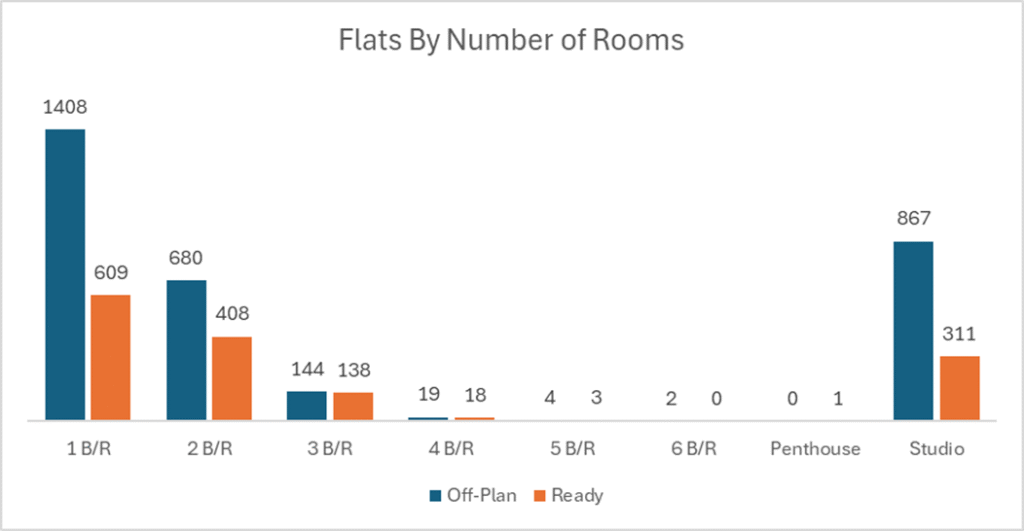
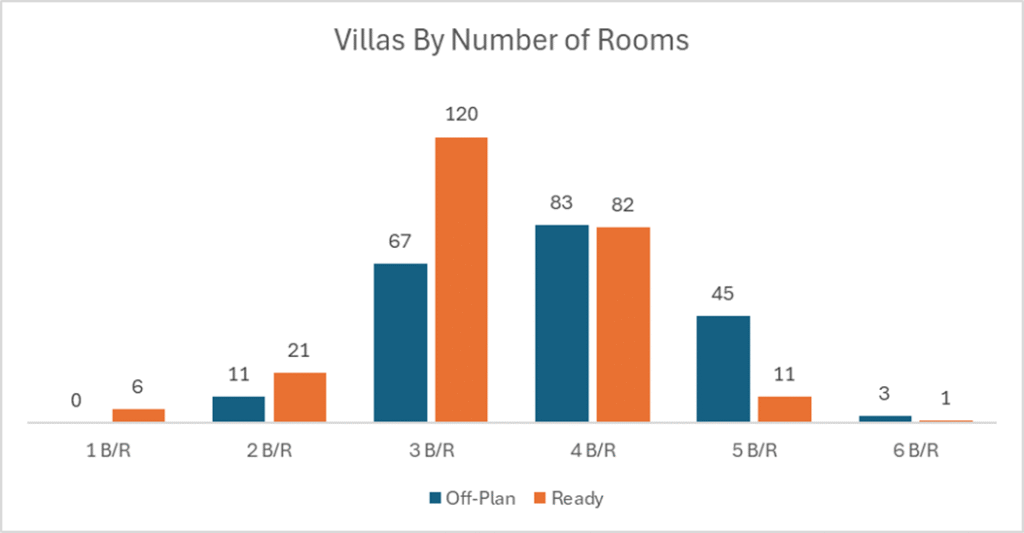
On the Micro Level
Below is the sales distribution based on the number of bedrooms
Weekly Comparison
| Metric | Week 46 | Week 47 | Change |
| Total Volume (AED billions) | 11.19 | 11.48 | +2.6% |
| Number of transactions | 5,160 | 5,284 | +2.4% |
Market Insights & Outlook
Week 47 delivered a moderate but broad-based uplift in both value and volume, with off-plan inching its share higher and remaining the primary driver of liquidity. The concentration of new off-plan value in emerging areas such as Madinat Al Mataar and Palm Deira (Deira Islands), alongside sustained ready demand in Downtown, Palm Jumeirah, Business Bay and Dubai Marina, suggests a market that is expanding geographically while still anchored by core prime districts.
If this pattern continues, Dubai is likely to see ongoing depth in prime ready resales alongside multi-cycle opportunities in new master-planned areas, keeping both investors and end-users active across the spectrum in the coming weeks.
Data Source: Dubai Land Department