

Dubai Real Estate Weekly Market Analysis 23-Mar-2026
- March 25, 2026
- 7
- News&Media
AED 5.82 billion in trading value in 3 days
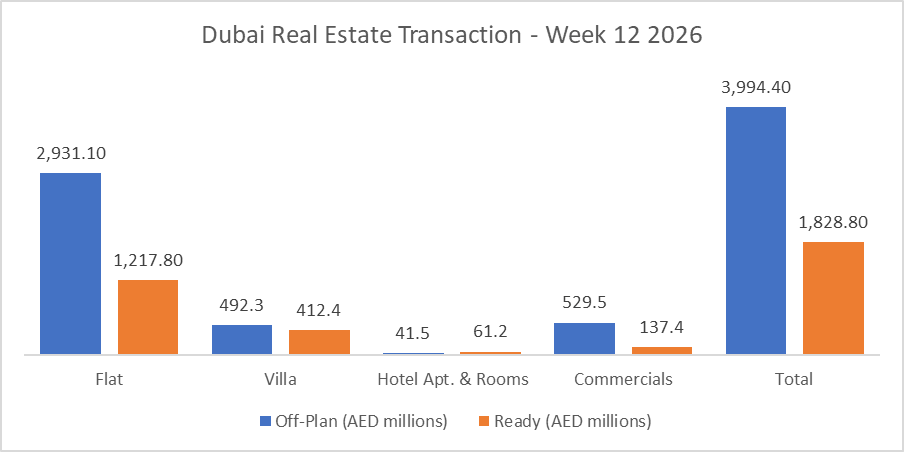
Total trading reached AED 5.82 billion across 2,520 transactions in Week 12. That was down from AED 8.26 billion and 4,327 transactions last week, but the softer headline needs to be read in context: this was an Eid Al Fitr-shortened week with only three working days. Off-Plan contributed AED 3.99 billion (68.6%), while Ready accounted for AED 1.83 billion (31.4%).
| Category | Off-Plan (AED millions) | Ready (AED millions) |
| Flat | 2,931.1 | 1,217.8 |
| Villa | 492.3 | 412.4 |
| Hotel Apt. & Rooms | 41.5 | 61.2 |
| Commercials | 529.5 | 137.4 |
| Total | 3,994.4 | 1,828.8 |
Off-Plan Market Performance
- Total Value: AED 3.99 billion
- Share of Weekly Total: 68.6%
| Category | Value (AED millions) | % of Off-Plan |
| Flat | 2,931.1 | 73.4% |
| Villa | 492.3 | 12.3% |
| Hotel Apt. & Rooms | 41.5 | 1.0% |
| Commercials | 529.5 | 13.3% |
Off-plan remained the engine of the market, with flats dominating at 73.4% of off-plan value, while commercials made a notable contribution at 13.3%, a relatively strong showing for the segment. Villas accounted for 12.3%, with hotel apartments and rooms contributing a smaller 1.0%. From a transaction-type perspective, off-plan activity was overwhelmingly sales-led, with sales contributing 99.7% of off-plan value, while gifts represented 0.3% and mortgages just 0.1%.
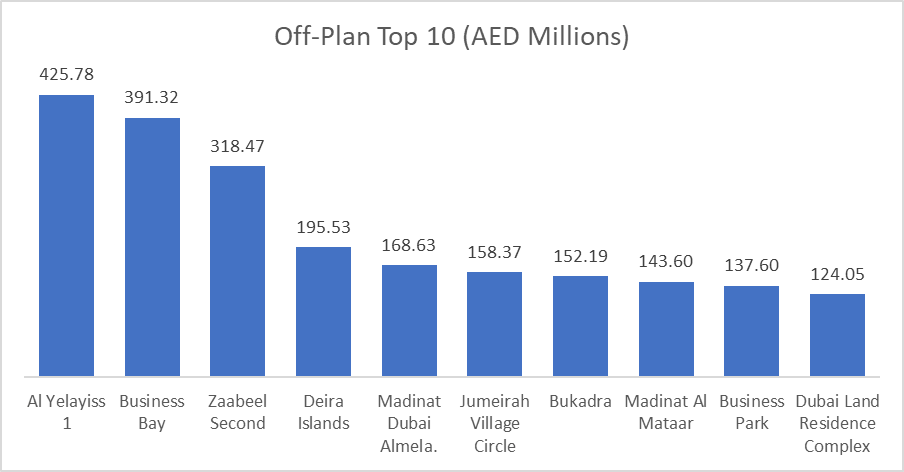
Top Performing Off-Plan Areas
The top 10 off-plan areas generated AED 2.22 billion, equal to 55.5% of total off-plan value, led by Al Yelayiss 1, Business Bay, and Zaabeel Second.
| Area | Value (AED millions) |
| Al Yelayiss 1 | 425.8 |
| Business Bay | 391.3 |
| Zaabeel Second | 318.5 |
| Deira Islands | 195.5 |
| Madinat Dubai Almelaheya | 168.6 |
Ready Market Performance
- Total Value: AED 1.83 billion
- Share of Weekly Total: 31.4%
| Category | Value (AED millions) | % of Ready |
| Flat | 1,217.8 | 66.6% |
| Villa | 412.4 | 22.6% |
| Hotel Apt. & Rooms | 61.2 | 3.3% |
| Commercials | 137.4 | 7.5% |
The ready market was also led by flats, which made up 66.6% of ready value, followed by villas at 22.6%. Commercials contributed 7.5%, while hotel apartments and rooms accounted for 3.3%. Unlike off-plan, the ready segment showed a much heavier financing component: sales contributed 53.2% of ready value, while mortgages represented a substantial 43.6%, pointing to strong financed end-user and investor activity in completed stock. Gifts contributed 3.2%.
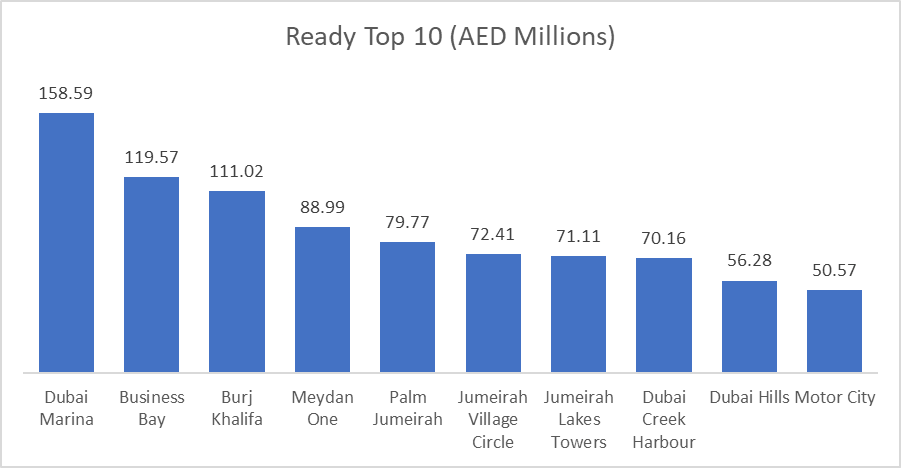
Top Performing Ready Areas
The top 10 ready areas generated AED 878.5 million, or 48.0% of total ready value, led by Dubai Marina, Business Bay, and Burj Khalifa.
| Area | Value (AED millions) |
| Dubai Marina | 158.6 |
| Business Bay | 119.6 |
| Burj Khalifa | 111.0 |
| Meydan One | 89.0 |
| Palm Jumeirah | 79.8 |
On the Micro Level
The week’s highest-ticket transactions showed strength at both the luxury and upper-mid ends of the market. On the off-plan side, the biggest flat deal was recorded in Jumeirah Second at AED 48.1 million, while the top villa transaction came from Keturah Reserve at AED 10.5 million. In the ready segment, the highest flat transaction was in Dubai Water Canal at AED 17.0 million, while the top villa deal was in Island 2 at AED 24.0 million.
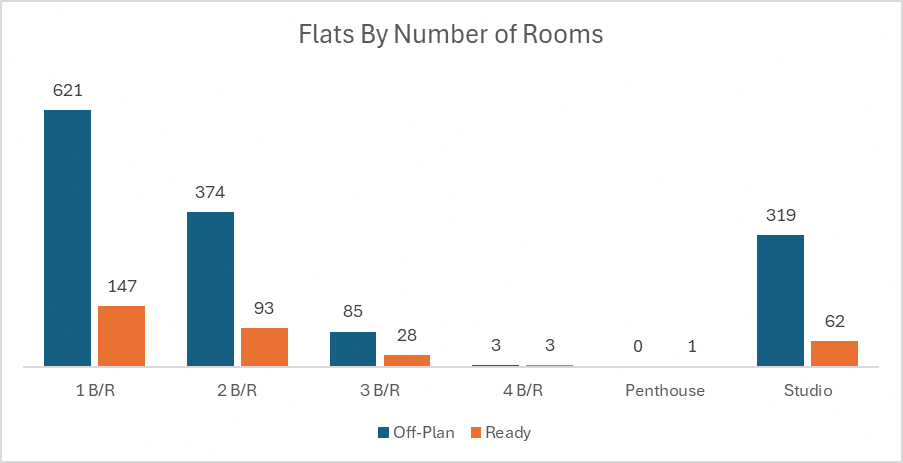
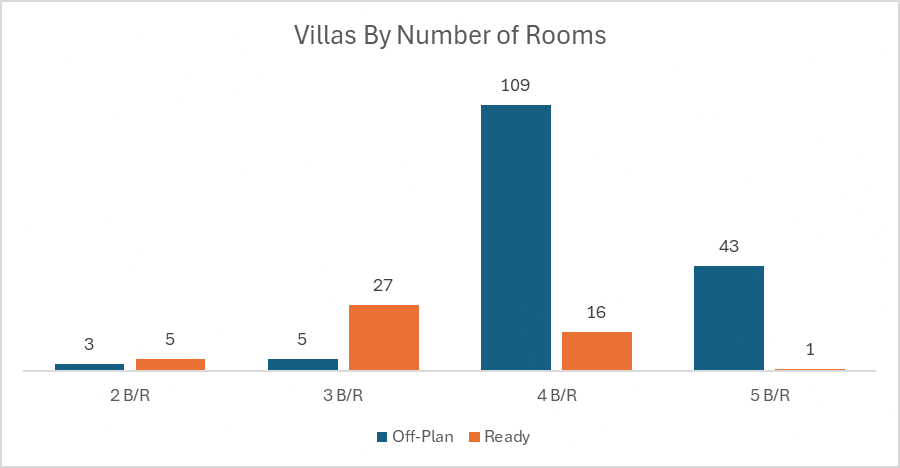
Below are sales by bedroom
Weekly Comparison
| Metric | Last Week | This Week | Change |
| Total Volume | AED8.26 billion | 5.82 | -29.5% |
| Transactions | 4,327 | 2,520 | -41.8% |
Market Insights & Outlook
At first glance, Week 12 looks like a clear step down from the previous week, but the calendar matters here. With only three working days because of the Eid Al Fitr holiday, the decline in headline volume and transaction count should not be read as a clean deterioration in underlying demand. The market still produced AED 5.82 billion in non-land trading, with off-plan retaining a commanding lead and continuing to absorb the majority of investor appetite.
The underlying mix was also constructive. Across both segments, sales accounted for 85.1% of total weekly value, while mortgages made up 13.7% and gifts just 1.2%. That tells a useful story: off-plan stayed almost entirely transactional and sales-driven, while the ready market showed deeper mortgage participation, reflecting stronger financed activity in completed properties. Area leadership also remained concentrated in established and high-velocity zones, with Business Bay appearing in both the off-plan and ready top rankings, while luxury-ready districts such as Dubai Marina, Burj Khalifa, and Palm Jumeirah continued to attract large-ticket demand.
Overall, this week reads less like a demand shock and more like a holiday-compressed trading window. Once a full working week resumes, the market will likely offer a better signal on whether momentum is merely paused or preparing to re-accelerate.
Data Source: Dubai Land Department
Only freehold transactions are included