

- April 21, 2026
- 4
- News&Media
Land transactions in September 2025 were 33.7% of the total transactions. The market activity decreased by AED 1.2 billion from August 2025, -2% MoM. And 14.4% increase YoY.
Dubai closed September 2025 with AED 65.76 billion in property transactions across 21,781 deals. This represents a 1.8% decline month-over-month versus August 2025’s AED 66.98 billion, but a 14.4% increase year-on-year versus September 2024’s AED 57.50 billion. Transaction count rose 6.5% from 20,452 in August to 21,781 in September.
| Metric | September 2025 | August 2025 | MoM Δ | September 2024 | YoY Δ |
| Total value | AED 65.76 bn | AED 66.98 bn | ▼ 1.8 % | AED 57.50 bn | ▲ 14.4 % |
| Transactions | 21,781 | 20,452 | ▲ 6.5 % | — | — |
Market Composition
| Segment | Value (AED bn) | Share of Total | Key Drivers |
| Land | 22.14 | 33.7 % | Large plots concentrated in Wadi Al Safa 3, Ras Al Khor, and DIP Second anchored value. |
| Off-Plan | 29.54 | 44.9 % | Flats (AED 25.58 bn, 86.6%) dominated, villas a clear second. |
| Ready | 14.09 | 21.4 % | Flats (AED 8.82 bn, 62.6%) led secondary activity; commercial had a notable 12.5% share of ready. |
Off-Plan Market Performance
| Sub-category | Value (AED bn) | % of Off-Plan |
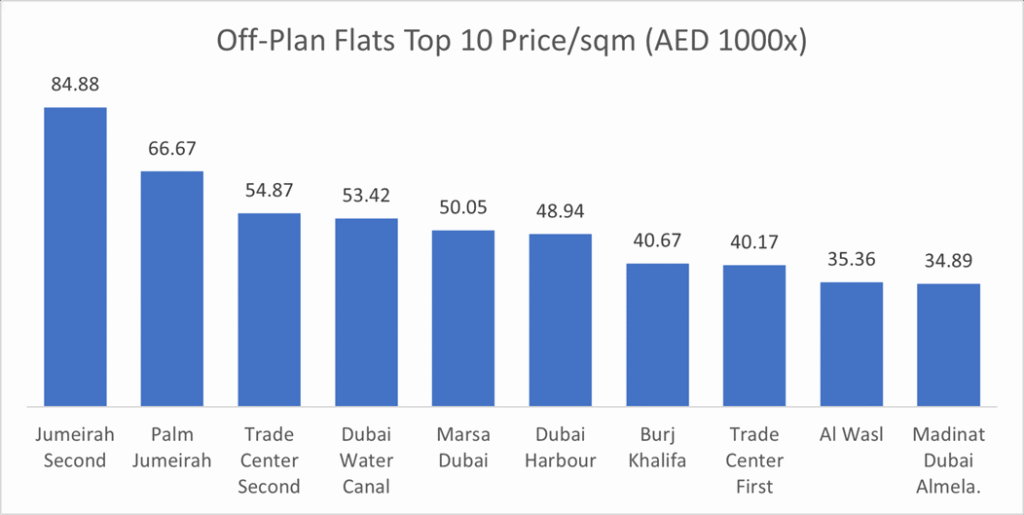
| Flats | 25.58 | 86.6 % |
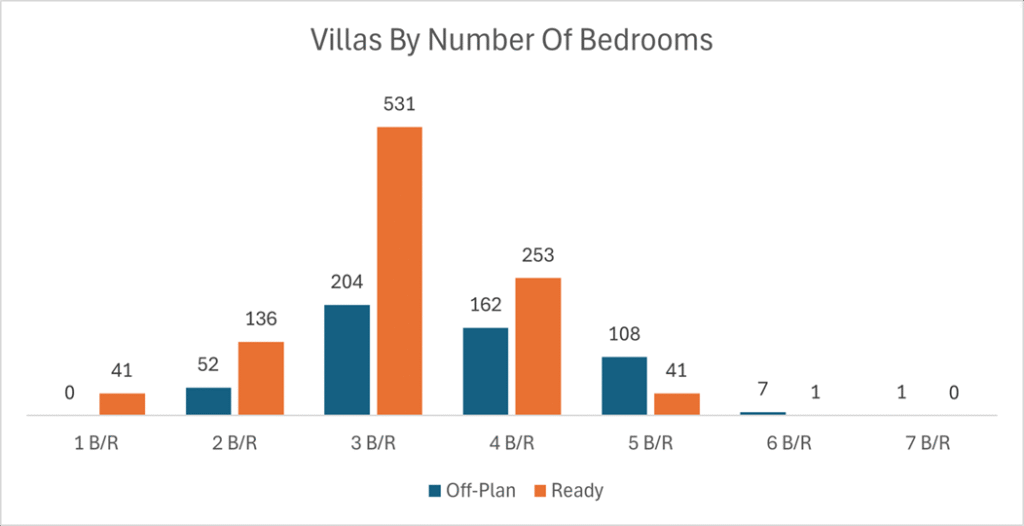
| Villas | 3.00 | 10.2 % |
| Hotel Apt. & Rooms | 0.83 | 2.8 % |
| Commercial | 0.40 | 1.4 % |
New-build apartments overwhelmingly carried off-plan spend; nearly 9 dirhams of every 10 went to flats.
Top Performing Areas
| Area | Value (AED bn) | % Of Off-Plan |
| Business Bay | 2.989 | 10.1% |
| Trade Center Second | 1.363 | 4.6% |
| JVC | 1.357 | 4.6% |
| DIP Second | 1.105 | 3.7% |
| Hadaeq Sheikh MBR | 1.067 | 3.6% |
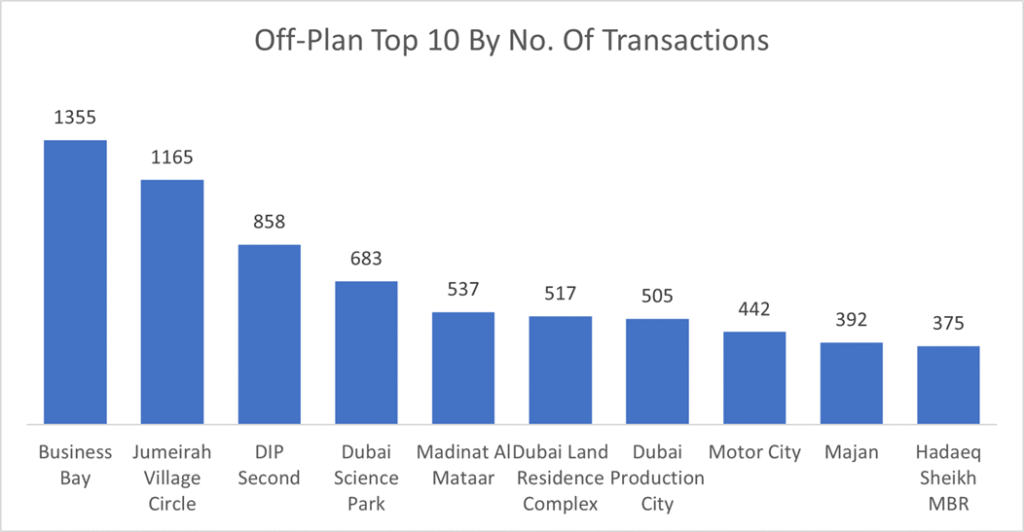
Business Bay dominated the off-plan market capturing more than 10% of the off-plan traded value, more than double that of the second place Trade Center Second.
The average price per square meter for off-plan flats stood at AED 23,580 almost unchanged from last month, while off-plan villas averaged AED 20,007 less than 1% increase from last month.
Ready Market Performance
| Sub-category | Value (AED bn) | % of Ready |
| Flats | 8.82 | 62.6 % |
| Villas | 2.98 | 21.1 % |
| Hotel Apt. & Rooms | 0.53 | 3.8 % |
| Commercial | 1.77 | 12.5 % |
Secondary sales stayed apartment-heavy, with villas holding just over one-fifth of ready spend.
Top Performing Areas
| Area | Value (AED bn) | % Of Ready |
| Business Bay | 1.413 | 10.0% |
| Burj Khalifa/Downtown | 1.411 | 10.0% |
| JVC | 0.875 | 6.2% |
| Palm Jumeirah | 0.854 | 6.1% |
| Dubai Marina | 0.802 | 5.7% |
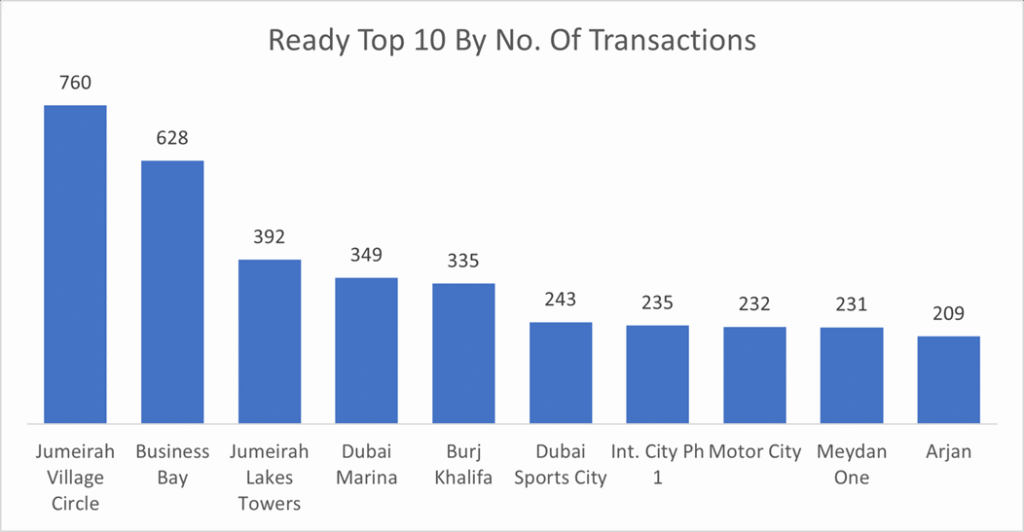
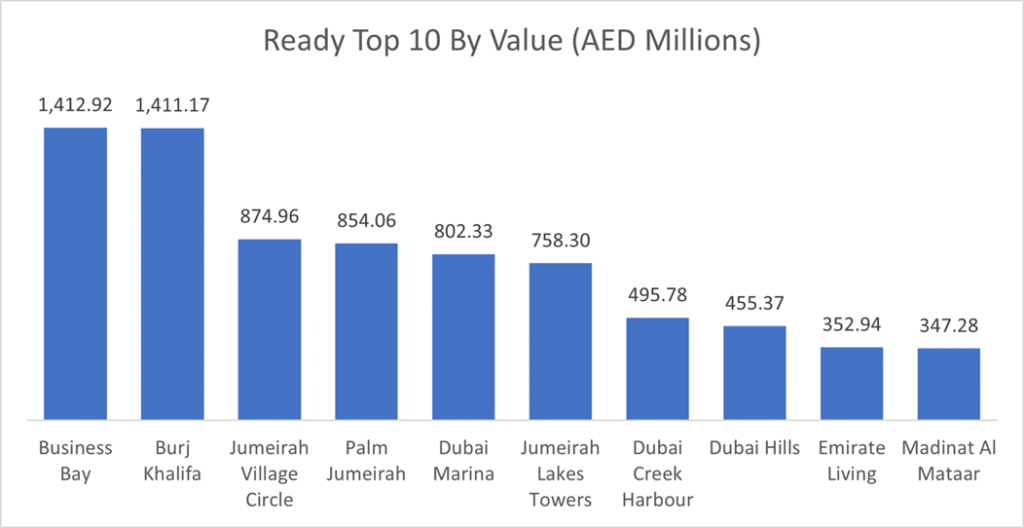
In the ready market, Business Bay topped the chart in the value traded while JVC booked secured the first place in number of transactions, both areas combined saw more than 16% of the secondary market traded value.
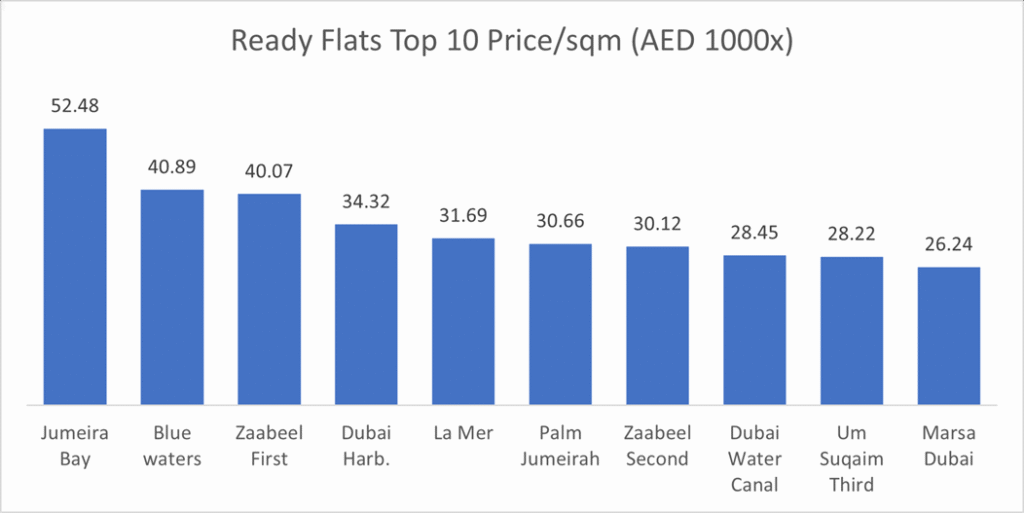
The average price per square meter for Ready Flats stood at AED 16,210 a 4.6% increase over last month, while Ready Villas averaged AED 13,034, almost unchanged from last month.
Land Transactions (Value)
| Area | Value (AED bn) |
| Wadi Al Safa 3 | 4.82 |
| Ras Al Khor | 2.90 |
| DIP Second | 1.66 |
| Me’Aisem Second | 1.59 |
| Al Yelayiss 1 | 1.05 |
On the Micro Level
Market Insights & Outlook
- Resilient liquidity: Despite a modest MoM dip in value (-1.8%), YoY growth (+14.4%) and rising deal counts (+6.5% MoM) highlight durable demand.
- Apartment supremacy: Across both segments, flats captured the lion’s share (off-plan 86.6%, ready 62.6%), reflecting affordability and faster handover cycles.
- Concentrated hotspots: Business Bay and JVC remain bellwethers, leading by either value, volume, or both; moves here often foreshadow wider market sentiment.
- Outlook: With sustained land acquisition and steady launch cadence, momentum should remain firm into Q4, though buyers are increasingly selective toward quality, payment flexibility, and location fundamentals.
Data Source: Dubai Land Department