

- April 22, 2026
- 3
- News&Media
Land transactions in October 2025 was 38.1% of the total transactions. The market activity increased by AED 7.4 billion from September 2025, up 11% MoM. But -0.8% YoY.
Dubai closed October 2025 with AED 73.20 billion in property transactions across 22,618 deals. This represents an 11.3% increase month-over-month versus September 2025’s AED 65.76 billion, and a 0.8% decrease year-on-year versus October 2024’s AED 73.77 billion. Transaction count rose 3.8% from 21,781 in September to 22,618 in October.
| Metric | October 2025 | September 2025 | MoM Δ | October 2024 | YoY Δ |
| Total value | AED 73.20 bn | AED 65.76 bn | ▲ 11.3 % | AED 73.77 bn | ▼ 0.8 % |
| Transactions | 22,618 | 21,781 | ▲ 3.8 % | — | — |
Market Composition
| Segment | Value (AED bn) | Share of Total | Key Drivers |
| Land | 27.85 | 38.1% | Large-plot activity and strategic site acquisitions; steady developer land banking. |
| Off-Plan | 28.38 | 38.8% | Launch-led demand; apartments in mid-market hubs carried volumes. |
| Ready | 16.97 | 23.2% | Broad secondary sales with apartments ~two-thirds of ready value. |
Off-Plan Market Performance
| Sub-category | Value (AED bn) | % of Off-Plan |
| Flats | 23.655 | 83.3% |
| Villas | 3.744 | 13.2% |
| Hotel Apt. & Rooms | 0.100 | 0.4% |
| Commercial | 0.884 | 3.1% |
New-build apartments overwhelmingly carried off-plan spend.
Top Performing Areas
| Area | Value (AED bn) | % Of Off-Plan |
| Business Bay | 1.864 | 6.6% |
| Palm Deira | 1.502 | 5.3% |
| JVC | 1.349 | 4.8% |
| Trade Center Second | 1.259 | 4.4% |
| DIP Second | 1.093 | 3.9% |
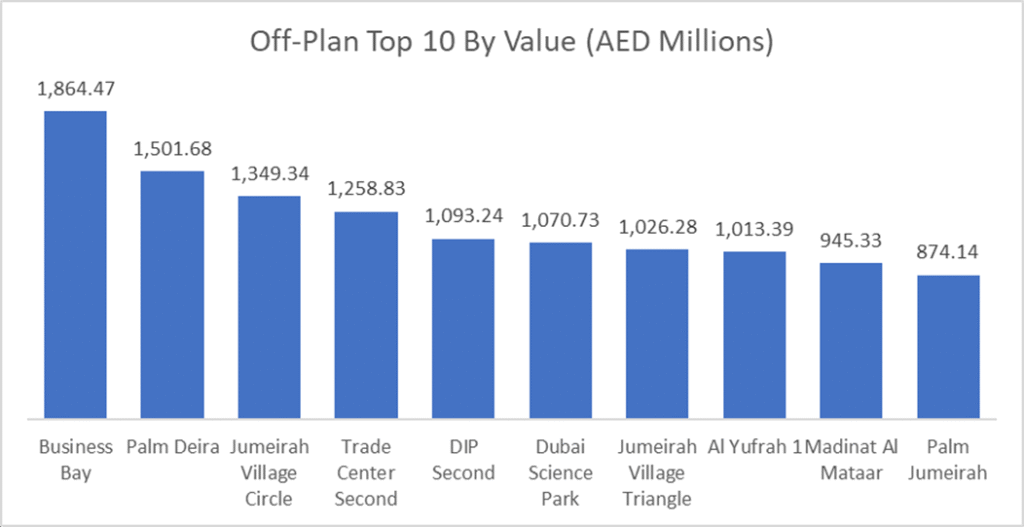
Business Bay dominated the off-plan market capturing more than 6.6% of the off-plan traded value, Palm Diera came second with 5.5% of the raded value. JVC stayed on top of the transactions chart.
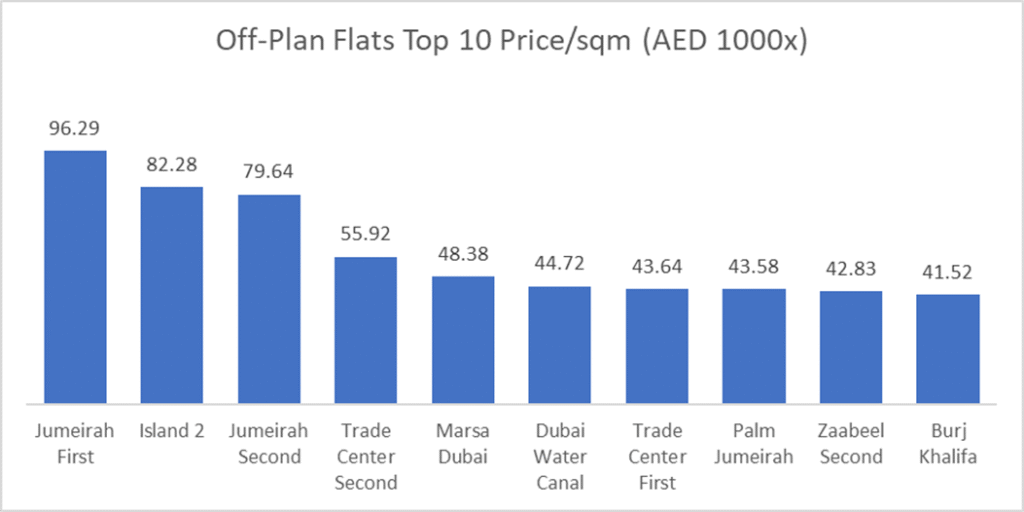
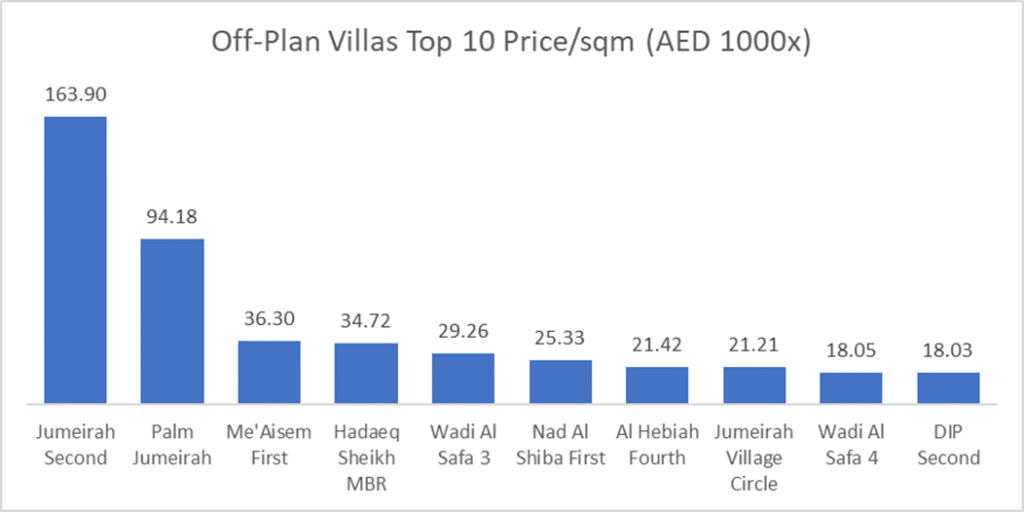
The average price per square meter for off-plan flats stood at AED 23,766 almost unchanged from last month, while off-plan villas averaged AED 20,235 less than 1% increase from last month.
Ready Market Performance
| Sub-category | Value (AED bn) | % of Ready |
| Flats | 11.097 | 65.4% |
| Villas | 3.567 | 21.0% |
| Hotel Apt. & Rooms | 0.769 | 4.5% |
| Commercial | 1.533 | 9.0% |
Secondary sales stayed apartment-heavy, with villas just over one-fifth of ready spend.
Top Performing Areas
| Area | Value (AED bn) | % Of Ready |
| Business Bay | 2.228 | 13.1% |
| Burj Khalifa (Downtown) | 1.517 | 8.9% |
| JVC | 1.041 | 6.1% |
| Palm Jumeirah | 0.900 | 5.3% |
| Dubai Marina | 0.884 | 5.2% |
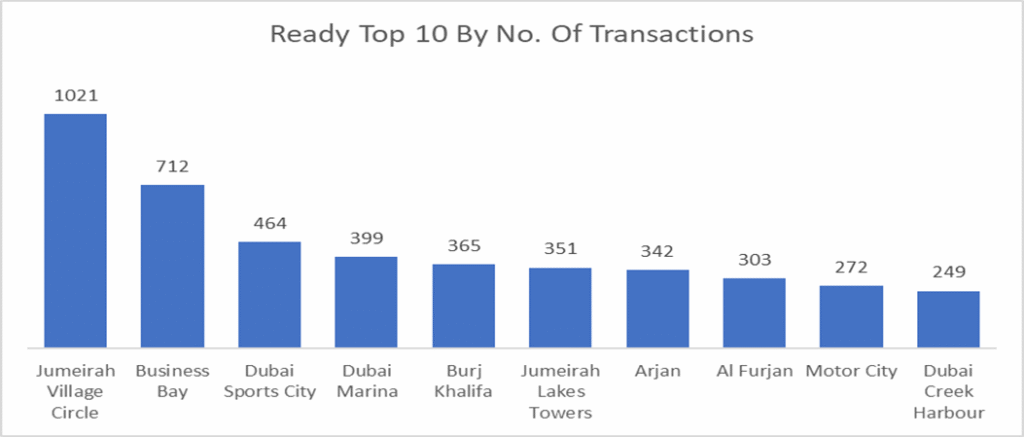
In the ready market, Business Bay topped the chart in the value traded while JVC secured the first place in number of transactions, both areas combined saw more than 19% of the secondary market traded value.
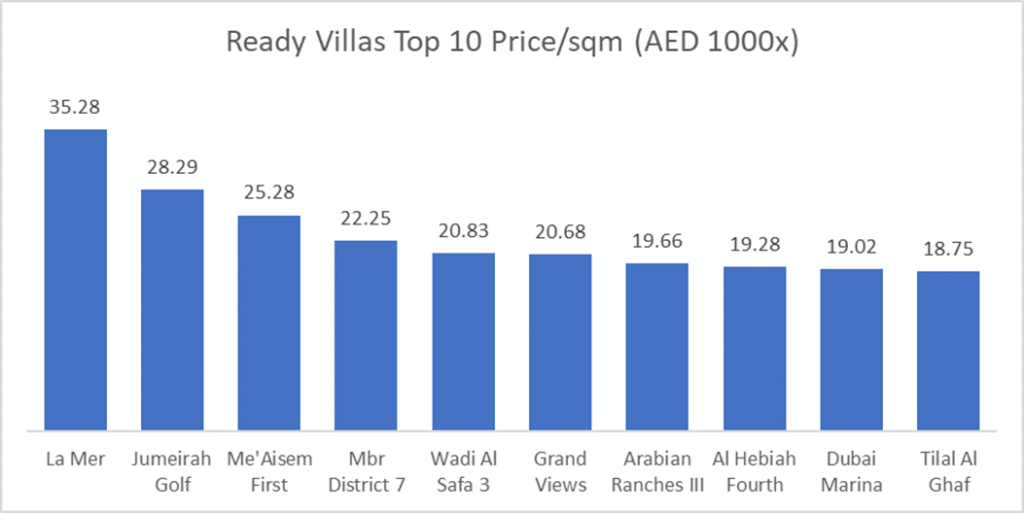
The average price per square meter for Ready Flats stood at AED 16,029 almost unchanged from last month, while Ready Villas averaged AED 13,649, 5% higher than last month average.
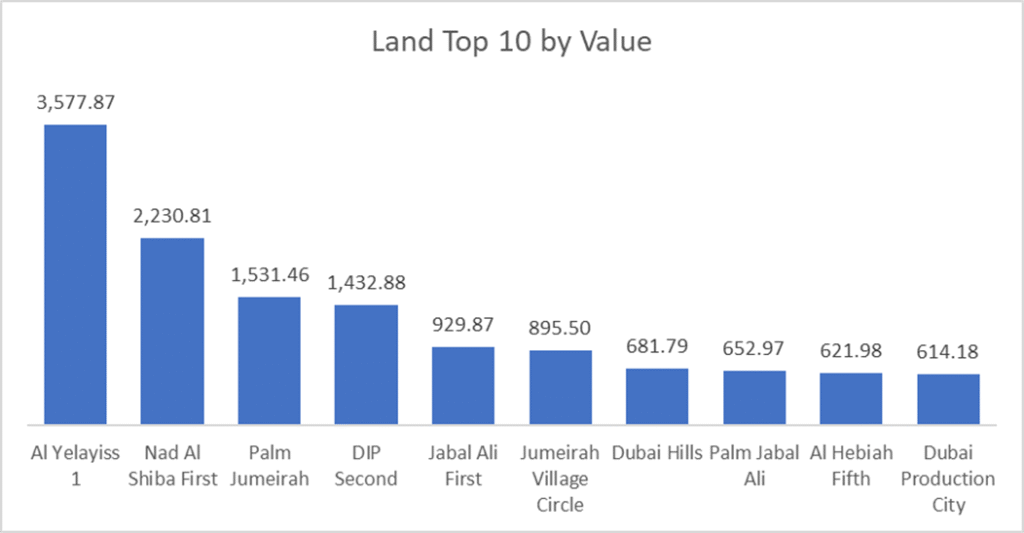
Land Transactions (Value)
| Area | Value (AED bn) |
| Al Yelayiss 1 | AED3.6 |
| Nad Al Shiba First | AED2.2 |
| Palm Jumeirah | AED1.5 |
| DIP Second | AED1.4 |
| Jabal Ali First | AED0.93 |
On the Micro Level
Market Insights & Outlook
- Resilient liquidity: Strong MoM rebound in value (+11.3%) and higher deal counts (+3.8%) underscore durable demand into Q4.
- Apartment supremacy: Flats dominated spend (off-plan 83.3%, ready 65.4%), aligning with affordability and breadth of product.
- Concentrated hotspots: Business Bay and JVC remained bellwethers, leading by either value, volume, or both; moves here often foreshadow wider sentiment.
- Outlook: With steady launches and ongoing land acquisitions, momentum should remain firm, though buyers are increasingly selective on payment flexibility, handover timelines, and micro-location fundamentals.
Data Source: Dubai Land Department