

- April 22, 2026
- 3
- News&Media
Land transactions in November 2025 were 41.5% of the total transactions. The market activity increased by AED 3.3 billion from October 2025, up 4.5% MoM and 35.3% YoY.
Dubai closed November 2025 with AED 76.52 billion in property transactions across 21,200 deals. This represents a 4.5% increase month-on-month versus October 2025’s AED 73.20 billion, and a 35.3% increase year-on-year versus November 2024’s AED 56.56 billion. Transaction count fell 6.3%, from 22,618 in October to 21,200 in November, indicating higher average ticket sizes despite fewer deals.
| Metric | November 2025 | October 2025 | MoM Δ | November 2024 | YoY Δ |
| Total value | AED 76.52 bn | AED 73.20 bn | ▲ 4.5 % | AED 56.56 bn | ▲ 35.3 % |
| Transactions | 21,200 | 22,618 | ▼ 6.3 % | — | — |
Market Composition
| Segment | Value (AED bn) | Share of Total | Key Drivers |
| Land | 31.74 | 41.5% | Large-ticket plot sales and strategic site acquisitions; active developer land banking. |
| Off-Plan | 28.77 | 37.6% | Strong launch pipeline; apartment-led demand in mid-market and emerging hubs. |
| Ready | 16.01 | 20.9% | Broad secondary sales with a tilt toward established communities and family villas. |
Off-Plan Market Performance
| Sub-category | Value (AED bn) | % of Off-Plan |
| Flats | 24.36 | 84.7% |
| Villas | 2.97 | 10.3% |
| Hotel Apt. & Rooms | 0.08 | 0.3% |
| Commercial | 1.36 | 4.7% |
New-build apartments overwhelmingly carried off-plan spend, with nearly 85% of off-plan dirhams flowing into flats. Villas contributed just over 10%, reflecting healthy interest in townhouse and villa projects, while commercial and hospitality remained niche but meaningful.
Top Performing Areas
| Area | Value (AED bn) | % Of Off-Plan |
| Business Bay | 2.06 | 7.2% |
| Madinat Al Mataar | 1.63 | 5.7% |
| Palm Deira | 1.60 | 5.6% |
| Jumeirah First | 1.50 | 5.2% |
| Dubai Maritime City | 1.43 | 5.0% |
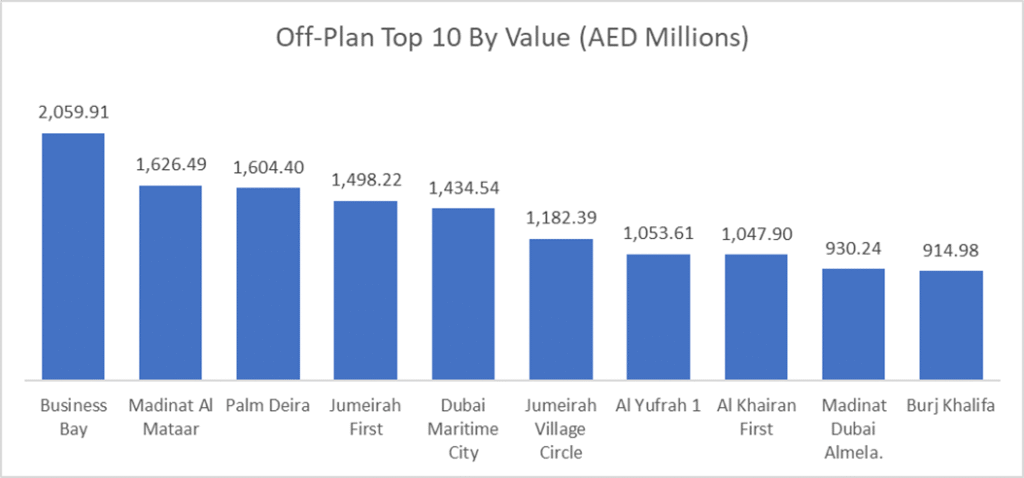
Business Bay dominated the off-plan market, capturing around 7.2% of off-plan traded value (AED 2.06 bn) and recording 675 transactions. Jumeirah Village Circle (JVC) stayed firmly on top of the transactions chart with 1,005 off plan deals and still generated a sizeable AED 1.18 bn in value. High-volume activity also concentrated in Jumeirah Village Triangle (733 deals), Madinat Al Mataar (720), Dubai Land Residence Complex (668) and Dubai Maritime City (650), underlining the strength of mid-market and emerging waterfront communities such as Palm Deira and the historic creekfront corridors.
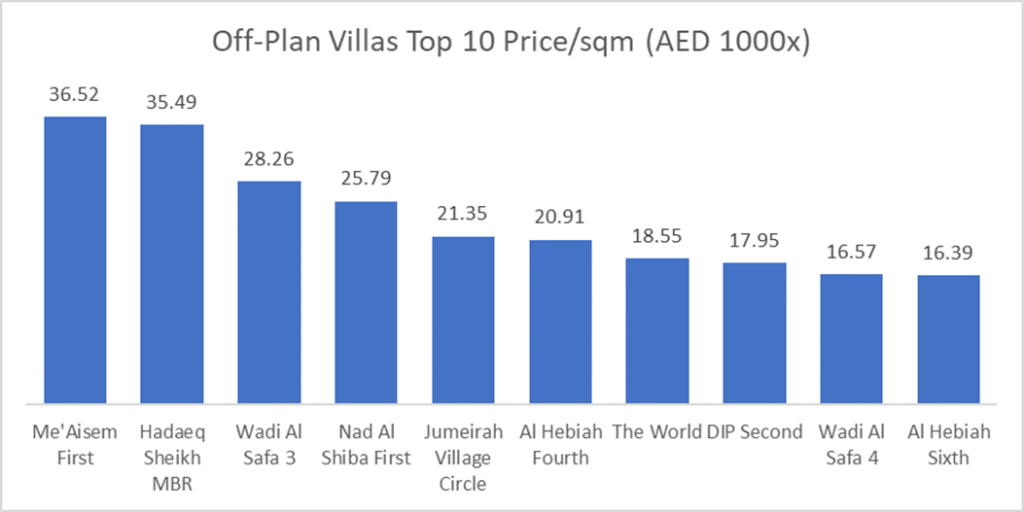
The average price per square meter for off-plan flats stood at AED 24,958 up 5% from last month, while off-plan villas averaged AED 16,353, down 19% from last month.
Ready Market Performance
| Sub-category | Value (AED bn) | % of Ready |
| Flats | 10.73 | 67.0% |
| Villas | 3.20 | 20.0% |
| Hotel Apt. & Rooms | 0.63 | 3.9% |
| Commercial | 1.45 | 9.1% |
Secondary sales stayed apartment-heavy, with flats accounting for about two-thirds of ready spend. Villas made up 20% of the ready market, highlighting persistent demand from end-users and upgraders, while commercial and hospitality assets together contributed just over 13%.
Top Performing Areas
| Area | Value (AED bn) | % Of Ready |
| Burj Khalifa (Downtown) | 1.79 | 11.2% |
| Business Bay | 1.20 | 7.5% |
| Palm Jumeirah | 0.97 | 6.1% |
| Dubai Marina | 0.96 | 6.0% |
| JVC | 0.80 | 5.0% |
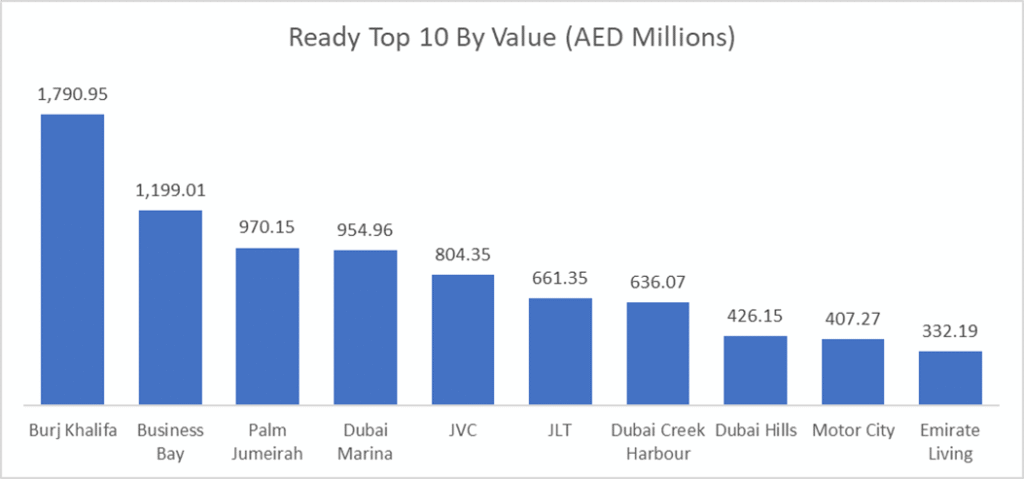
In the ready market, the Burj Khalifa district topped the value charts with AED 1.79 bn, around 11.2% of all ready transactions, and 366 deals. Business Bay ranked second by value (AED 1.20 bn) and posted 616 ready transactions, confirming it as a core liquidity hub. JVC led by number of ready deals with 705 transactions, while also featuring in the top five by value (AED 0.80 bn). Alongside Palm Jumeirah and Dubai Marina, these areas together accounted for roughly one-third of total ready market value, underscoring the concentration of demand in well-established, amenity-rich communities.
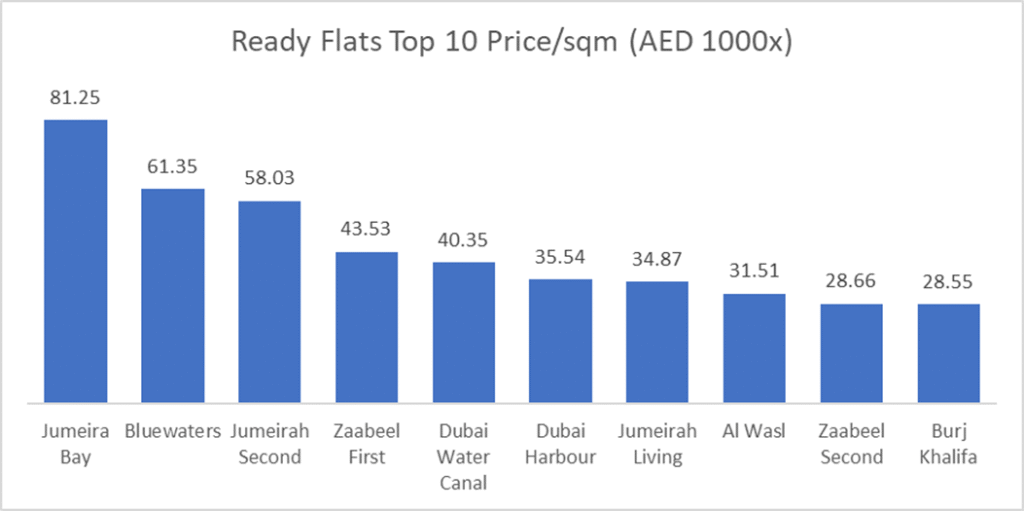
The average price per square meter for Ready Flats stood at AED 16,238 1% higher than last month, while Ready Villas averaged AED 13,932, 2% higher than last month average.
Land Transactions (Value)
Total land transactions in November reached AED 31.74 billion, driven by large-plot trades in key master communities and strategic acquisitions for future mixed-use and residential projects. The scale of land activity signals continued confidence from developers in Dubai’s medium-to-long-term demand trajectory.
On the Micro Level
Market Insights & Outlook
Higher values, fewer deals: A 4.5% rise in total value alongside a 6.3% drop in transactions points to larger average ticket sizes and a shift toward higher-value assets, especially in prime and waterfront locations.
Land-heavy expansion: With land representing over 41% of total traded value, November was a land-driven month, indicating active pipeline replenishment and new project planning across multiple corridors.
Apartment-led demand: Flats continued to dominate both segments (84.7% of off-plan and 67.0% of ready value), aligning with affordability, investor preference for easily rentable stock, and the sheer breadth of apartment inventory.
Concentrated hotspots: Business Bay, JVC, Burj Khalifa, Palm Jumeirah and Dubai Marina remained bellwethers—leading by value, volume, or both. Off-plan momentum clustered in JVC, JVT, Madinat Al Mataar and Palm Deira, while ready liquidity concentrated in Downtown, Business Bay and the key waterfront districts.
Outlook: Heading into year-end and early 2026, momentum looks firm but more selective. Buyers are increasingly focused on micro-location, quality of product, payment flexibility and handover visibility, while developers continue to lock in land and push new launches in the strongest demand corridors.
Data Source: Dubai Land Department