

Dubai Real Estate Market Review: March 2026
- April 7, 2026
- 1
- News&Media
March 2026 Sees Market Pullback as Transaction Value Slips Sharply from February
In March 2026, Dubai recorded a total transacted value of AED53.37 billion across 16,855 transactions. Off plan led with AED23.52 billion (44.1%), while Ready contributed AED10.50 billion (19.7%) and Land added AED19.34 billion (36.2%). Compared with February 2026, total value fell 29.2% from AED75.37 billion, while transaction count declined 19.2% from 20,852. Against March 2025, total value was down just 13% from AED61.19 billion.
| Category | Value (AED bn) | Share of Monthly Total |
| Off-Plan | 23.52 | 44.1% |
| Ready | 10.50 | 19.7% |
| Land | 19.34 | 36.2% |
| Total | 53.37 | 100.0% |
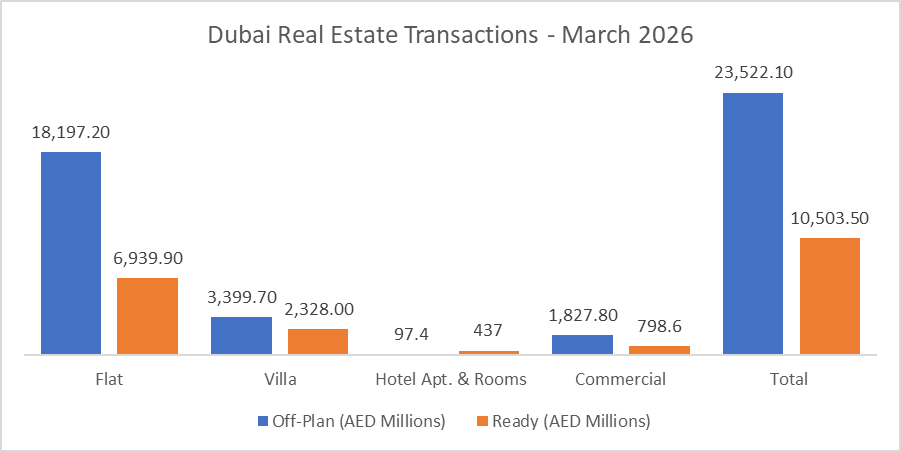
| Category | Off-Plan (AED Millions) | Ready (AED Millions) |
| Flat | 18,197.2 | 6,939.9 |
| Villa | 3,399.7 | 2,328.0 |
| Hotel Apt. & Rooms | 97.4 | 437.0 |
| Commercial | 1,827.8 | 798.6 |
| Total | 23,522.1 | 10,503.5 |
Off-Plan Market Performance
- Total Value: AED23.52 billion
- Share of Monthly Total: 44.1%
| Category | Value (AED bn) | % of Off-Plan |
| Flat | 18.20 | 77.4% |
| Villa | 3.40 | 14.5% |
| Hotel Apt. & Rooms | 0.10 | 0.4% |
| Commercial | 1.83 | 7.8% |
| Total | 23.52 | 100.0% |
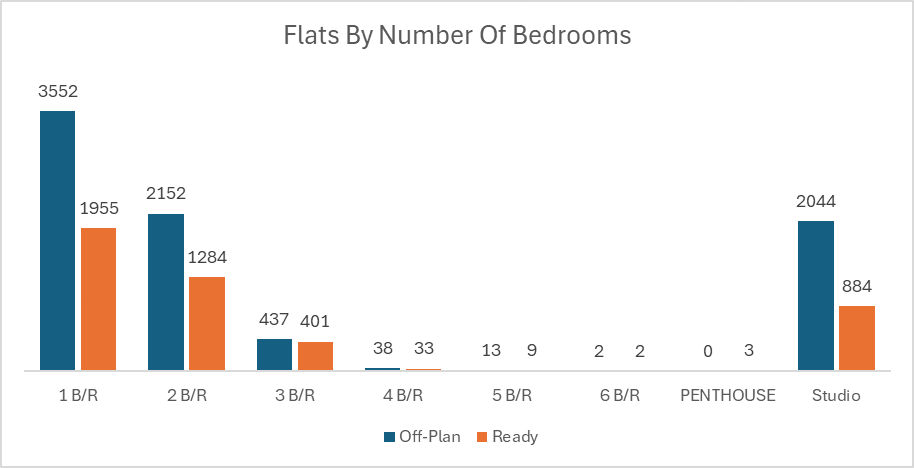
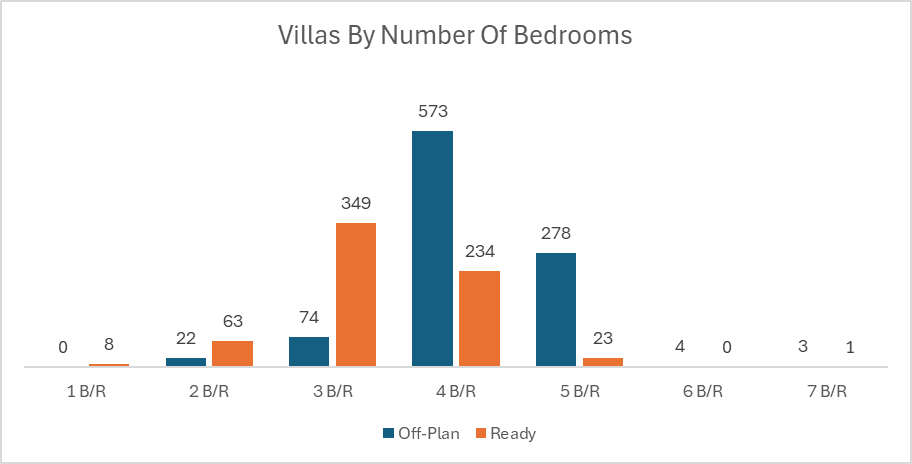
March’s off-plan market remained overwhelmingly apartment-driven, with flats alone generating more than three-quarters of segment value. Villas added a healthy secondary layer, while commercial stock also made a meaningful contribution, showing that investor appetite was not limited to residential launches.
Top Performing Off-Plan Areas
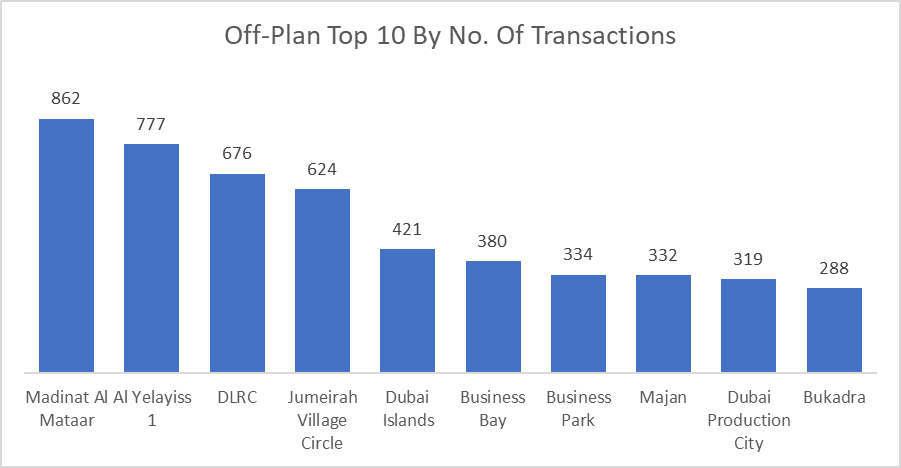
By number of transactions, activity was led by more affordable and high-absorption districts:
- Madinat Al Mataar: 862
- Al Yelayiss 1: 777
- DLRC: 676
- Jumeirah Village Circle: 624
- Dubai Islands: 421
By value traded, the ranking shifted toward larger-ticket and strategic master-planned locations:
- Al Yelayiss 1: AED2.46 billion
- Madinat Al Mataar: AED1.47 billion
- Dubai Islands: AED1.40 billion
- Business Bay: AED1.26 billion
- Jumeirah Second: AED1.15 billion
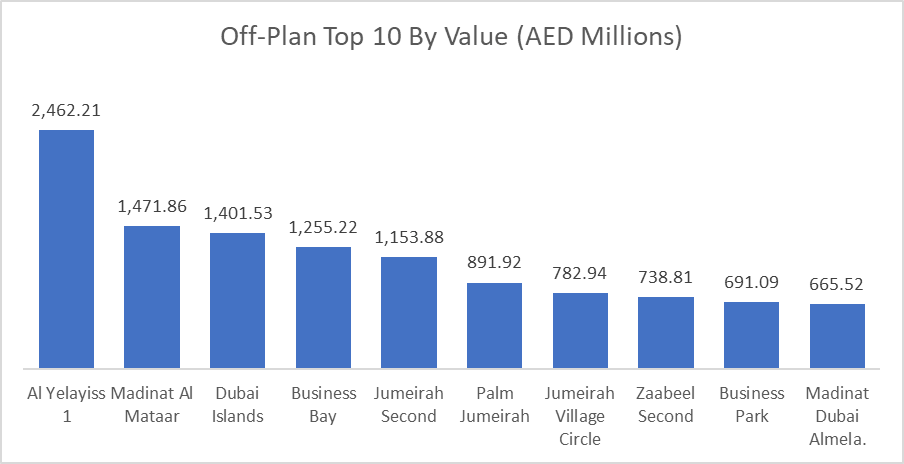
This split is important: transaction volume was concentrated in broad-market absorption zones, while value concentration tilted toward premium and strategic locations. In other words, March’s off-plan market had both width and depth.
Top Performing Off-Plan Projects
The top 10 off-plan projects generated AED4.91 billion, equal to about 20.9% of total off-plan value. The leaders were:
- Aman Residences Dubai: AED1.08 billion
- Skyvue: AED532.9 million
- Damac Islands 2 – Tahiti 2: AED527.1 million
- Passo By Beyond: AED523.5 million
- Hado By Beyond: AED488.1 million
At the micro level, the off-plan market’s biggest single flat transaction came from Aman Residences in Jumeirah Second at AED422 million, underlining how a handful of ultra-prime deals can materially lift monthly value even when broader transaction volumes are spread across mid-market communities.
Ready Market Performance
- Total Value: AED10.50 billion
- Share of Monthly Total: 19.7%
| Category | Value (AED bn) | % of Ready |
| Flat | 6.94 | 66.1% |
| Villa | 2.33 | 22.2% |
| Hotel Apt. & Rooms | 0.44 | 4.2% |
| Commercial | 0.80 | 7.6% |
| Total | 10.50 | 100.0% |
The ready market was also led by flats, though less heavily than off-plan. Villas accounted for a much larger share here, reflecting the role of the secondary market in end-user and luxury villa transactions. Relative to off-plan, the ready segment showed a more balanced mix across residential, hospitality-linked, and commercial assets.
Top Performing Ready Areas
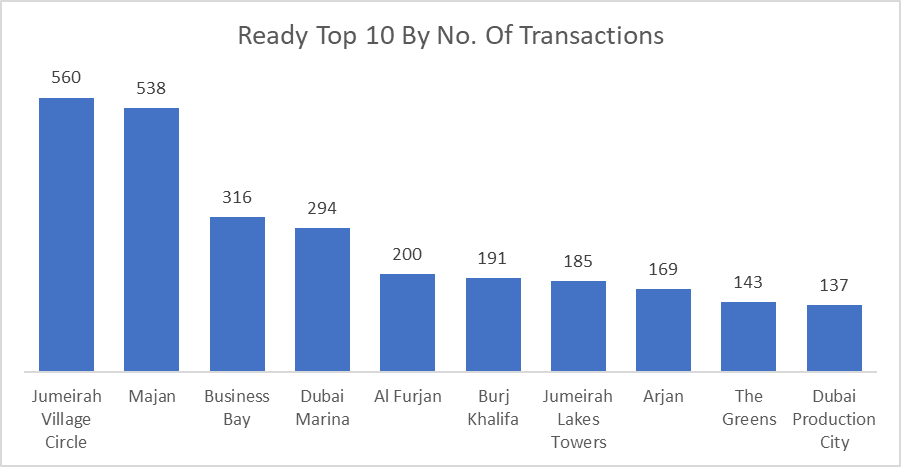
By number of transactions, the most active ready-market districts were:
- Jumeirah Village Circle: 560
- Majan: 538
- Business Bay: 316
- Dubai Marina: 294
- Al Furjan: 200
By value traded, prime and mature communities dominated:
- Dubai Marina: AED697.9 million
- Business Bay: AED694.4 million
- Jumeirah Village Circle: AED631.8 million
- Burj Khalifa: AED619.8 million
- Palm Jumeirah: AED607.6 million
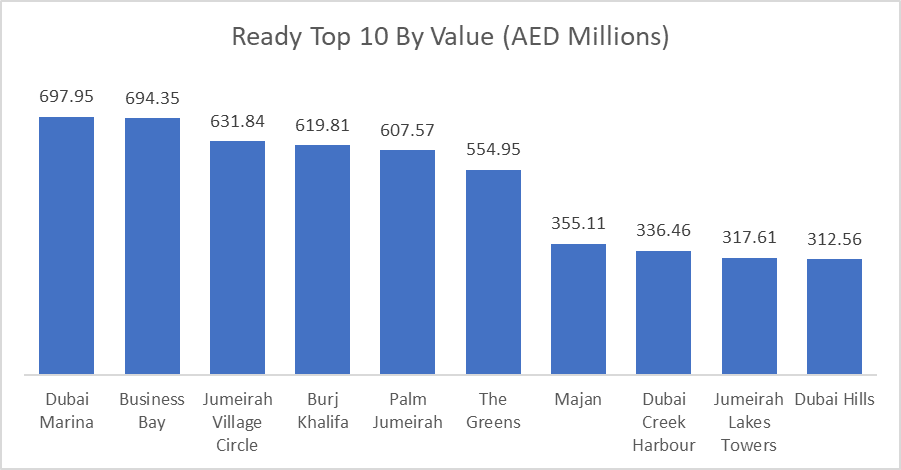
This tells a clear story: JVC and Majan were volume engines, but Dubai Marina, Business Bay, Burj Khalifa, and Palm Jumeirah carried the pricing power.
Top Performing Ready Projects
The top 10 ready projects generated AED1.42 billion, or about 13.6% of total ready value. The leaders were:
- The Onyx: AED426.7 million
- Sulafa Tower: AED174.7 million
- Bluewaters Residences: AED145.7 million
- Aura: AED136.8 million
- W Residences Dubai – The Palm: AED112.5 million
The concentration here was lower than in off-plan, suggesting the ready market’s value was spread across a wider set of projects and communities.
Land Market Performance
- Total Value: AED19.34 billion
- Share of Monthly Total: 36.2%
Land remained a major pillar of March activity, accounting for more than a third of all transacted value.
Top Performing Land Areas by Value
- Al Yelayiss 5: AED3.41 billion
- Me’Aisem Second: AED1.35 billion
- Hadaeq Sheikh MBR: AED1.02 billion
- Palm Jabal Ali: AED870.5 million
- Palm Jumeirah: AED829.5 million
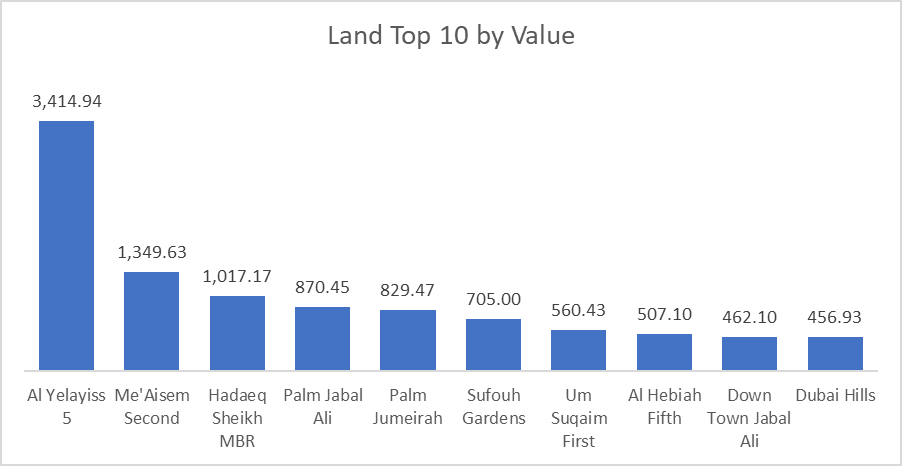
Land clearly played an outsized role in shaping the month’s overall value; however, it was smaller than the previous months. Without land, the market would have stood at AED34.03 billion, meaning land was the swing factor behind March’s aggregate scale.
Highest Transaction Value
| Segment | Asset Type | Area / Project | Value |
| Off-Plan | Flat | Jumeirah Second (Aman Residences) | AED422,000,000 |
| Off-Plan | Villa | Wadi Al Safa 3 (Karl Lagerfeld Villas By Taraf) | AED43,421,000 |
| Ready | Flat | Bluewaters | AED90,000,000 |
| Ready | Villa | Palm Jumeirah (EOME) | AED100,000,000 |
| Land | Land | Sufouh Gardens | AED705,000,000 |
These headline transactions show that ultra-prime stock and strategic land parcels continued to anchor the top end of the market, even as mass-market districts drove a large share of the monthly deal count.
Transaction Type Ex-Land
| Transaction Type | Off-Plan | Ready |
| Gifts | AED163.2 million | AED676.3 million |
| Mortgage | AED107.5 million | AED4.24 billion |
| Sales | AED23.25 billion | AED5.59 billion |
Off-plan value was almost entirely sales-led:
- Sales: 98.8%
- Gifts: 0.7%
- Mortgage: 0.5%
Ready market value was far more balanced:
- Sales: 53.2%
- Mortgage: 40.3%
- Gifts: 6.4%
That gap is structurally important. The off-plan market remains primarily a developer-sales market, while the ready segment reflects a more mature financing-backed resale market.
On The Micro Level
Monthly Comparison
| Metric | Feb 2026 | Mar 2026 | Change |
| Total Value | AED75.37 bn | AED53.37 bn | -29.2% |
| Transactions | 20,852 | 16,855 | -19.2% |
| Metric | Mar 2025 | Mar 2026 | Change |
| Total Value | AED54.08 bn | AED61.19 bn | -13% |
Market Insights & Outlook
March 2026 showed a softer month-on-month profile versus February largely due to the current geopolitical concerns, with both value and transaction count pulling back, the year-on-year comparison wasn’t much different. The structure of the month was notable: off-plan remained the main transactional engine, ready retained depth in core urban districts, and land continued to command a very large share of capital deployment.
The area rankings also reveal a two-speed market. High-volume communities such as Madinat Al Mataar, Al Yelayiss 1, JVC, and Majan drove deal flow, while prime districts such as Jumeirah Second, Palm Jumeirah, Dubai Marina, and Business Bay captured disproportionate value. That combination points to a market that still has both speculative breadth and premium depth.
For April, the key question is whether transaction activity rebounds from March’s lower base, especially in secondary market volume, or whether the market remains more selective with value increasingly supported by large land and trophy transactions rather than broad-based acceleration.
Data Source: Dubai Land Department
*Only freehold transactions were used