

- April 22, 2026
- 4
- News&Media
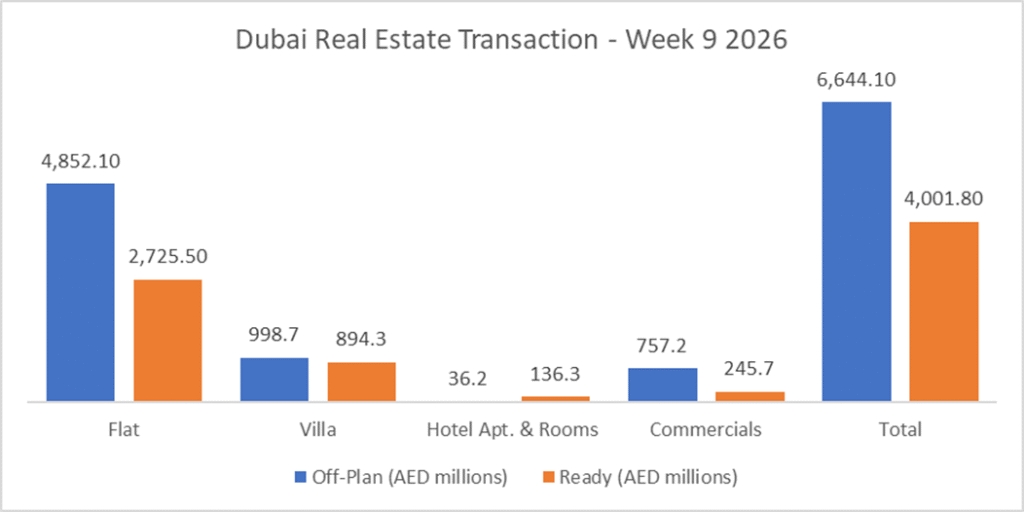
Total trading reached AED10.65 bn in Week 9 across 4,841 transactions. Off-Plan dominated with AED6.64 bn (62.4%), while Ready accounted for AED4.00 bn (37.6%). Land transactions reached AED 10 bn.
| Category | Off-Plan (AED millions) | Ready (AED millions) |
| Flat | 4,852.1 | 2,725.5 |
| Villa | 998.7 | 894.3 |
| Hotel Apt. & Rooms | 36.2 | 136.3 |
| Commercials | 757.2 | 245.7 |
| Total | 6,644.1 | 4,001.8 |
Off-Plan Market Performance
Total Value: AED6.64 bn
Share of Weekly Total: 62.4%
| Off-Plan Category | Value (AED billions) | % of Off-Plan |
| Flat | 4.85 | 73.0% |
| Villa | 1.00 | 15.0% |
| Hotel Apt. & Rooms | 0.04 | 0.5% |
| Commercials | 0.76 | 11.4% |
| Total | 6.64 | 100.0% |
Top Performing Off-Plan Areas
Top 10 areas generated AED 3.1 bn (47.1% of Off-Plan value).
| Area | Value (AED millions) | % of Off-Plan |
| Dubai Islands | 489.4 | 7.4% |
| Business Bay | 431.5 | 6.5% |
| Al Yelayiss 1 | 423.6 | 6.4% |
| Business Park | 305.1 | 4.6% |
| Madinat Al Mataar | 284.7 | 4.3% |
Ready Market Performance
Total Value: AED4.00 bn
Share of Weekly Total: 37.6%
| Ready Category | Value (AED billions) | % of Ready |
| Flat | 2.73 | 68.1% |
| Villa | 0.89 | 22.3% |
| Hotel Apt. & Rooms | 0.14 | 3.4% |
| Commercials | 0.25 | 6.1% |
| Total | 4.00 | 100.0% |
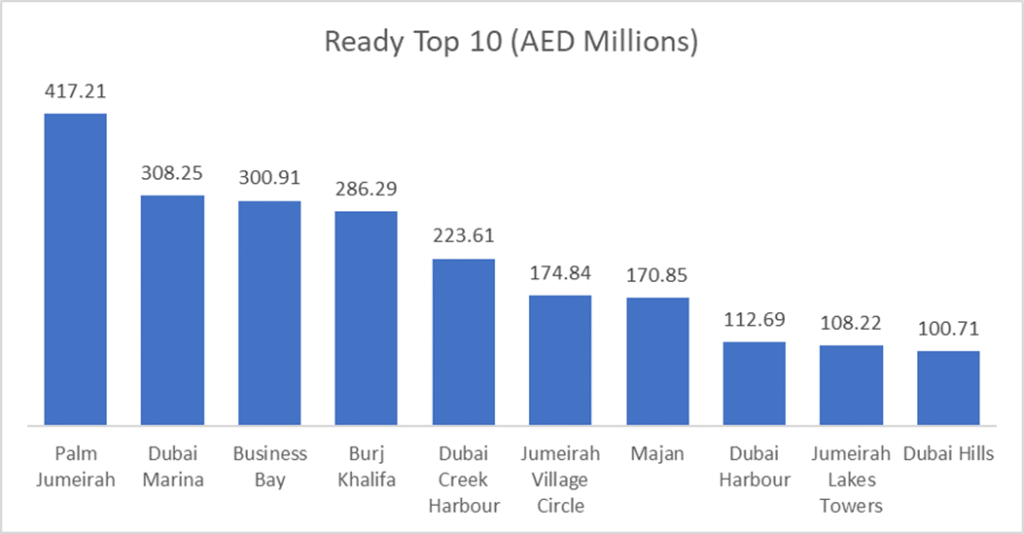
Top Performing Ready Areas
Top 10 areas generated AED 2.2 bn (55.1% of Ready value).
| Area | Value (AED millions) | % of Ready |
| Palm Jumeirah | 417.2 | 10.4% |
| Dubai Marina | 308.3 | 7.7% |
| Business Bay | 300.9 | 7.5% |
| Burj Khalifa | 286.3 | 7.2% |
| Dubai Creek Harbour | 223.6 | 5.6% |
On the Micro Level
Weekly Comparison
| Metric | Last Week | This Week | Change |
| Total Value | AED10.17 bn | AED10.65 bn | +AED0.48 bn (+4.7%) |
| Transactions | 4,184 | 4,841 | +657 (+15.7%) |
Market Insights & Outlook
Week 9 delivered a higher-value, higher-activity market versus last week: total traded value rose 4.7%, while transactions jumped 15.7%, a combination that points to a broader mid-market uplift (average ticket size eased from ~AED2.43m to ~AED2.20m, -9.5%).
Structurally, the market remained understandably flat-led: flats contributed ~71.2% of total value (Off-Plan flats at AED4.85 bn alone made up 73.0% of Off-Plan). Villas were the clear #2 at ~17.8% of total value, while commercials (~9.4%) leaned heavily Off-Plan (AED0.76 bn vs AED0.25 bn Ready), signalling stronger forward-looking business/property positioning in the pipeline.
Geographically, value concentration stayed high: the top 10 Off-Plan areas captured 47.1% of Off-Plan value, led by Dubai Islands, Business Bay, and Al Yelayiss 1, while the top 10 Ready areas captured 55.1%, led by Palm Jumeirah, Dubai Marina, and Business Bay. The repeated appearance of Business Bay, Palm Jumeirah, and JVC across both segments highlights where liquidity and developer/buyer confidence are clustering as the market scales into Q1 momentum.
In light of the recent events, we will be monitoring the market closely to determine the effects of the market.
Data Source: Dubai Land Department
Only freehold transactions are included