

- April 22, 2026
- 4
- News&Media
The total real estate transactions in Dubai for Week 4 were AED 10.82 billion and 4,594 transactions. Off-Plan contributed 62.8% or 6.79 billion, while Ready properties contributed 37.2% or 4.03 billion.
Total trading reached AED 10.82B across 4,594 transactions in Week 4. Off-Plan led with AED 6.79B (62.8%), while Ready contributed AED 4.03B (37.2%).
| Category | Off-Plan (AED millions) | Ready (AED millions) |
| Flat | 4,387.7 | 2,496.3 |
| Villa | 1,223.7 | 909.0 |
| Hotel Apt. & Rooms | 621.8 | 211.1 |
| Commercials | 559.7 | 410.1 |
| Total | 6,792.8 | 4,026.5 |
Off-Plan Market Performance
- Total Value: AED 6.79B
- Share of Weekly Total: 62.8%
| Category | Value (AED millions) | % of Off-Plan |
| Flat | 4,387.7 | 64.6% |
| Villa | 1,223.7 | 18.0% |
| Hotel Apt. & Rooms | 621.8 | 9.2% |
| Commercials | 559.7 | 8.2% |
Off-plan activity was flat-led, with nearly two-thirds of off-plan value concentrated in apartments, supported by meaningful contributions from villas and hospitality-linked stock.
Top Performing Off-Plan Areas
The top 10 off-plan areas recorded AED 3.95B, representing 58.1% of total off-plan value (strong concentration in a handful of locations).
| Area | Value (AED millions) | % of Off-Plan |
| Al Yelayiss 1 | 687.4 | 10.1% |
| Business Bay | 606.0 | 8.9% |
| The World | 558.3 | 8.2% |
| Dubai Islands | 484.1 | 7.1% |
| Tecom Site A | 340.1 | 5.0% |
Ready Market Performance
- Total Value: AED 4.03B
- Share of Weekly Total: 37.2%
| Category | Value (AED millions) | % of Ready |
| Flat | 2,496.3 | 62.0% |
| Villa | 909.0 | 22.6% |
| Hotel Apt. & Rooms | 211.1 | 5.2% |
| Commercials | 410.1 | 10.2% |
Ready transactions were also apartment-driven, but with a stronger villa share than off-plan, and a comparatively higher commercial contribution.
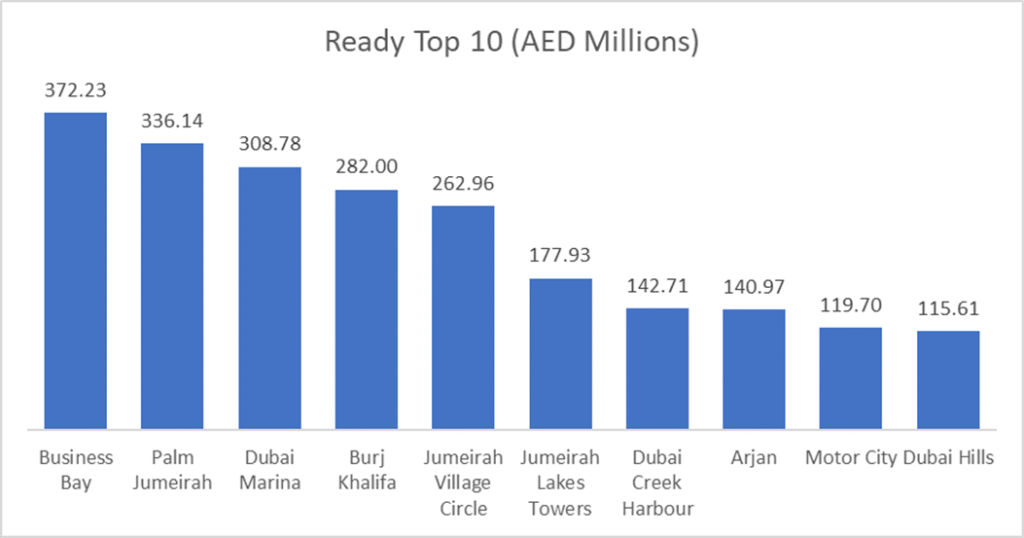
Top Performing Ready Areas
The top 10 ready areas reached AED 2.26B, accounting for 56.1% of total ready value (similarly concentrated market depth).
| Area | Value (AED millions) | % of Ready |
| Business Bay | 372.2 | 9.2% |
| Palm Jumeirah | 336.1 | 8.3% |
| Dubai Marina | 308.8 | 7.7% |
| Burj Khalifa | 282.0 | 7.0% |
| Jumeirah Village Circle | 263.0 | 6.5% |
On the Micro Level
Weekly Comparison
| Metric | Last Week | This Week | Change |
| Total Volume | AED 11.55B | AED 10.82B | -AED 0.73B (-6.3%) |
| Total Number of Transactions | 4,896 | 4,594 | -302 (-6.2%) |
Market Insights & Outlook
Week 4 cooled versus last week on both value and activity, but the market’s structure stayed consistent: off plan remained the primary driver (nearly 63% of total value), while ready demand clustered in prime, liquid hubs. The area rankings underline concentration: Business Bay appeared in both segments’ top lists, while prime waterfront/urban cores (Palm Jumeirah, Dubai Marina, Burj Khalifa) anchored ready performance and large master-development zones (Al Yelayiss 1, Dubai Islands, Al Khairan First) supported off-plan momentum.
Data Source: Dubai Land Department