

- April 22, 2026
- 4
- News&Media
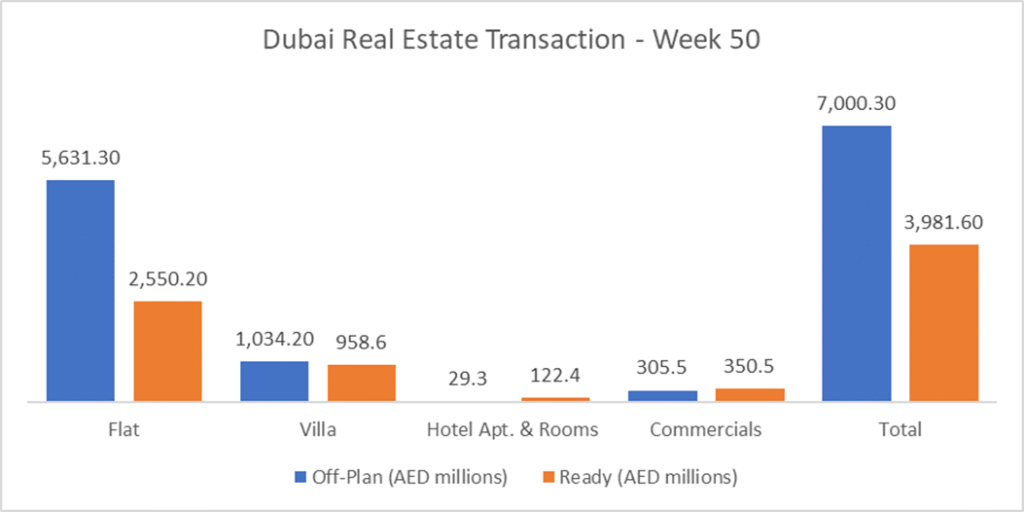
The total real estate transactions in Dubai for Week 50 were AED 10.98 billion and 4,793 transactions. Off-Plan contributed 63.7% or 7.00 billion, while Ready properties contributed 36.3% or 3.98 billion.
In Week 50, total trading reached AED 10.98 bn a 75% increase in value from last week (3-day week) across 4,793 transactions. Off-Plan dominated with AED 7.00 bn (63.7%), while Ready accounted for AED 3.98 bn (36.3%).
| Category | Off-Plan (AED millions) | Ready (AED millions) |
| Flat | 5,631.3 | 2,550.2 |
| Villa | 1,034.2 | 958.6 |
| Hotel Apt. & Rooms | 29.3 | 122.4 |
| Commercials | 305.5 | 350.5 |
| Total | 7,000.3 | 3,981.6 |
Off-Plan Market Performance
Total Value: AED 7.00 bn
Share of Weekly Total: 63.7%
| Category | Value (AED bn) | % of Off-Plan |
| Flat | 5.63 | 80.4% |
| Villa | 1.03 | 14.8% |
| Hotel Apt. & Rooms | 0.03 | 0.4% |
| Commercials | 0.31 | 4.4% |
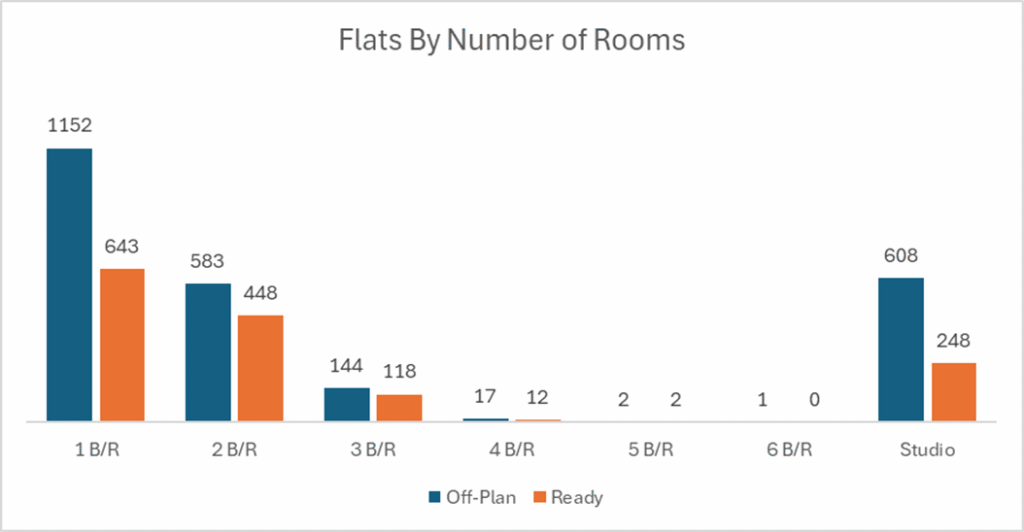
Off-plan activity was overwhelmingly apartment-led, with Off-Plan Flats alone contributing ~51.3% of the entire week’s traded value.
Top Performing Off-Plan Areas
| Area | Value (AED millions) | % of Off-Plan |
| Business Bay | 1,276.1 | 18.2% |
| DIP Second | 754.7 | 10.8% |
| Palm Deira | 350.7 | 5.0% |
| Jumeirah Village Circle | 283.3 | 4.0% |
| Dubai Maritime City | 254.0 | 3.6% |
Business Bay once again is the leader of off-plan trading with 18% market share, followed by strong absorption in DIP Second and Palm Deira, signaling investor appetite for centrally located and emerging infrastructure-backed corridors.
Ready Market Performance
Total Value: AED 3.98 bn
Share of Weekly Total: 36.3%
| Category | Value (AED bn) | % of Ready |
| Flat | 2.55 | 64.0% |
| Villa | 0.96 | 24.1% |
| Hotel Apt. & Rooms | 0.12 | 3.1% |
| Commercials | 0.35 | 8.8% |
Ready transactions were also flat-driven, but with stronger diversification than Off-Plan, especially through Villas and Commercials.
Top Performing Ready Areas
| Area | Value (AED millions) | % of Ready |
| Burj Khalifa | 335.7 | 8.4% |
| Business Bay | 318.4 | 8.0% |
| Palm Jumeirah | 274.7 | 6.9% |
| Dubai Marina | 233.8 | 5.9% |
| Jumeirah Village Circle | 209.2 | 5.3% |
Burj Khalifa emerged as the top destination for the secondary market with market share of 8.4%, while Business Bay came close second with 8% of the total secondary market. The usual suspects, Palm Jumeirah, Dubai Marina, and JVC came in the third, fourth and fifth places.
On the Micro Level
Weekly Comparison
| Metric | Week 49 | Week 50 | Change |
| Total Value (AED bn) | 6.25 | 10.98 | +4.73 (+75.8%) |
| Transactions | 2,823 | 4,793 | +1,970 (+69.8%) |
Market Insights & Outlook
Week 50 shows a sharp re-acceleration in activity, led by Off-Plan (63.7% share) and powered primarily by Flat sales (80.4% of Off-Plan). Trading value was also highly concentrated by area: the top 10 Off-Plan areas represented 54.9% of Off-Plan value, while the top 10 Ready areas contributed 52.1%—a clear signal that liquidity remains focused in a handful of high-demand hubs.
Two areas stand out across both segments: Business Bay (ranked #1 Off-Plan and #2 Ready) and Jumeirah Village Circle (top 5 in both), reinforcing their role as year-round volume engines. On the Ready side, Burj Khalifa, Palm Jumeirah, and Dubai Marina underline continued appetite for established prime inventory, while Off-Plan strength in DIP Second and Palm Deira suggests ongoing rotation into new(er) launch corridors.