
- April 23, 2026
- 3
- Real Estate
INVESTOR BRIEFING 2026
A Comprehensive Developer Analysis
Beyond Developments · Select Group · SOL Properties · Dubai Properties
| USD 10M Investor Target | 6.9% Avg Dubai Yield | AED 100.5B 2025 Market Volume | 0% Capital Gains Tax |
Prepared for: Prospective Overseas Investor
Currency: USD (1 USD = AED 3.67) · Date: Q1 2026
DISCLAIMER: This report is for informational purposes only and does not constitute investment advice.
| SECTION 1 — EXECUTIVE SUMMARY |
This briefing provides an institutional-grade analysis of four leading Dubai real estate developers — Beyond Developments, Select Group, SOL Properties, and Dubai Properties — with a focus on current and future project pipelines, ROI metrics, rental yields, and strategic investment positioning for a USD 10 million overseas investor.
10 Key Investor Highlights
- Dubai delivered AED 100.5B in property transactions in 2025, a 27.4% year-on-year increase, confirming structural market strength.
- Zero capital gains tax, zero income tax, and zero inheritance tax on UAE real estate create a net yield advantage of 2–4% over comparable global markets.
- Select Group has delivered 7,000+ units across 20M sq ft — the most established track record of the four developers profiled.
- Beyond Developments (est. 2024, backed by Omniyat Group) has launched 10 projects in just 18 months, with a combined pipeline value exceeding AED 12 billion.
- SOL Properties’ Fairmont Residences Solara Tower in Downtown Dubai and Ocean House on Palm Jumeirah represent best-in-class branded residence investments with 5.7–7.0% gross yields.
- Dubai Properties (a Dubai Holding subsidiary) offers the lowest entry risk — government-backed, master-planned communities with 25+ years of delivery history and 40,000+ units across Dubai.
- Select Group’s Six Senses Residences on Palm Jumeirah has shown 60–90% capital appreciation since launch — the highest of any project reviewed.
- Beyond’s Dubai Maritime City masterplan (8M sq ft) is the largest single waterfront development pipeline in Dubai, offering early-mover pricing for investors.
- Dubai’s gross rental yield of 6.9% compares to 3.2% in London, 3.0% in Singapore, 4.2% in New York, and 3.5% in Sydney — all before the tax differential is applied.
- For a USD 10M portfolio spread across these four developers, projected gross annual income ranges from USD 621,000 to USD 720,000 depending on allocation strategy.
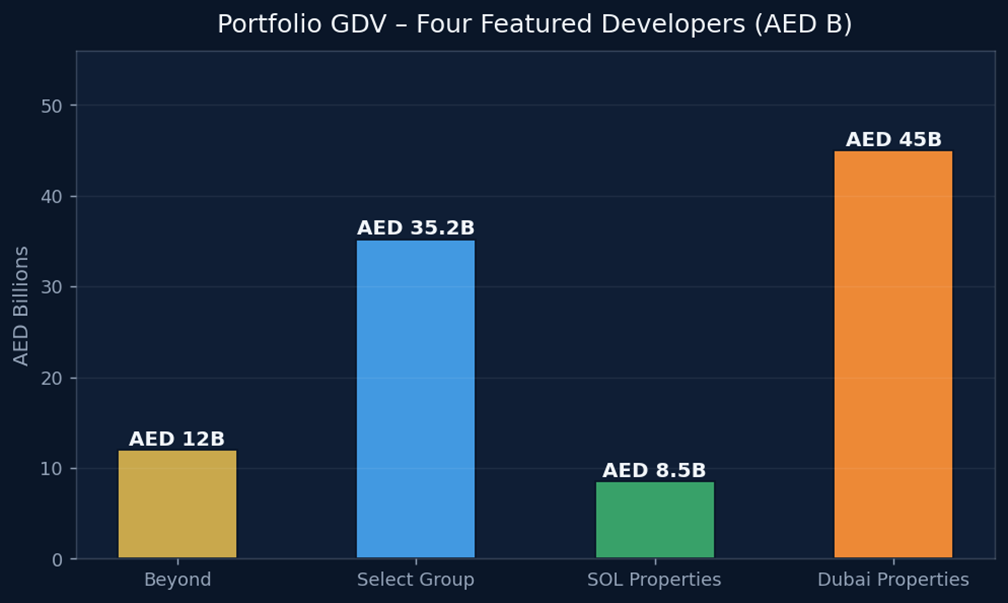
Figure: Portfolio Gross Development Value — Four Featured Developers (AED Billions)
| SECTION 2 — BEYOND DEVELOPMENTS |
Developer Overview
Beyond Developments was established in 2024 as a premium real estate brand under the Omniyat Group — one of Dubai’s most respected luxury property conglomerates. Despite being less than two years old, Beyond has launched 10 projects with a combined pipeline value exceeding AED 12 billion, making it one of the fastest-growing luxury developers in UAE history. The developer is constructing an 8-million-square-foot waterfront masterplan along Dubai Maritime City’s coastline — the centrepiece of its Dubai strategy.
Developer Credentials
- Parent Company: Omniyat Group (established 2005, AED 40B+ in delivered projects)
- Focus Areas: Dubai Maritime City (primary masterplan), Palm Jumeirah, Dubai Islands, Ras Al Khaimah
- Design Philosophy: Biophilic luxury — architecture integrating nature, wellness, and waterfront lifestyle
- First Commercial Tower: 31 Above (Grade A freehold offices, Dubai Maritime City)
- Target Market: Ultra-HNW investors and lifestyle buyers — primary price range AED 1.9M to AED 25M+
- Payment Plans: Typically 50/50 or 60/40 (down to 5–10% booking fee), interest-free construction financing
- Rental Yield Range: 6.0–9.5% depending on location; Dubai Maritime City projects target 6–8%
─────────────────────────────────────────────────────────────────────────────────────────
Complete Project Portfolio — All 10 Projects
| Project | Location | Handover | Type | Entry Price | Payment Plan | Key Notes |
| Saria | Dubai Maritime City | 2028 | Residential | AED 2.1M | 50/50 | Sold out. First project — flagship DMC launch. Luxury apts & chalets. |
| Orise | Dubai Maritime City | Q1 2028 | Residential | AED 1.9M | 50/50 (5% book) | 2-tower (51+32 fl). 1–4 BR, chalets, penthouses. Early-mover pricing. |
| Kanyon | Dubai Maritime City | Q3 2028 | Residential | AED 3.9M | 50/50 | Designer tower. High-end 2–4BR. Strong capital appreciation expected. |
| Sensia | Dubai Maritime City | Mar 2029 | Residential | AED 2.1M | 10/40/50 | 3.2m ceilings, terrace gardens, dual-aspect views, penthouse collection. |
| The Mural | Dubai Maritime City | 2029 | Residential | AED 2.3M | TBC | 36-storey landmark. 1–3BR, duplexes, maisonettes + signature penthouse. |
| Soulever | Dubai Maritime City | 2029 | Residential | AED 2.5M | TBC | AED 2.6B development. Part of 8M sqft DMC masterplan. |
| Hado | Dubai Islands (Siora) | 2029 | Residential | AED 0.8M | 20% DP+1%/month | Japanese-inspired design (Ikigai concept). 1–4BR incl. duplexes. 8–10% exp yield. |
| Passo | Palm Jumeirah West Crescent | Q2–Q3 2029 | Residential | AED 5.5M | 60/40 | 1–6BR + beach mansions. Beachfront, biophilic architecture. ~5.3% yield. |
| Le Château | Al Marjan Island, RAK | Q4 2029 | Residential | AED 2.15M | TBC | 31-storey, 257 units. Near Wynn resort. Capital appreciation play. |
| 31 Above | Dubai Maritime City | 2028 | Commercial | AED 4.5M | TBC | First freehold commercial tower. Grade A offices. High STR/office yield potential. |
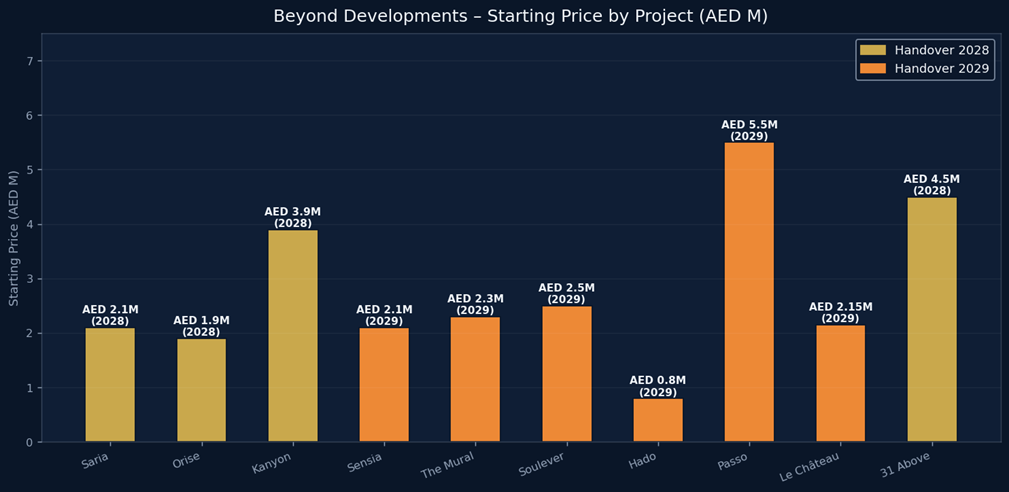
Figure: Beyond Developments: Starting Price per Project (AED Millions)
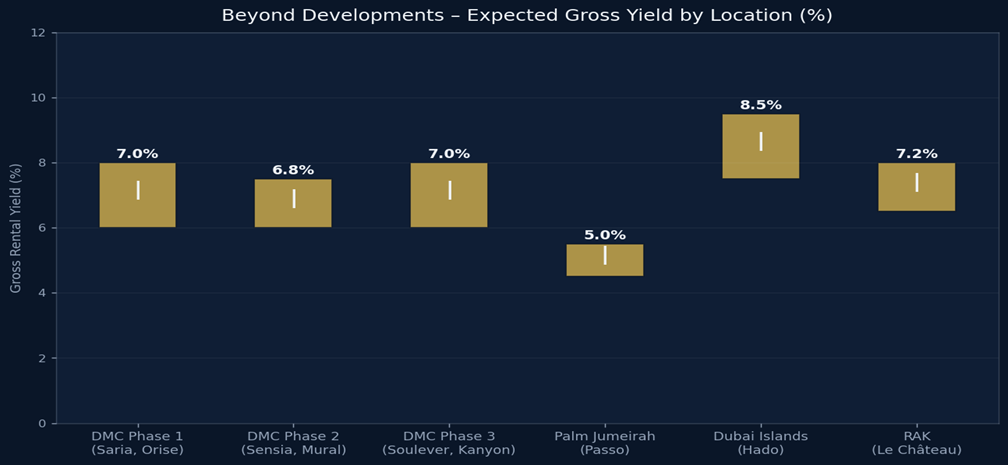
Figure: Beyond Developments: Expected Gross Rental Yield by Location (%)
──────────────────────────────────────────────────────────────────────────────────────────
Dubai Maritime City — Masterplan Analysis
Dubai Maritime City (DMC) is a 2.27 km² free zone peninsula on the Dubai coastline, originally conceived in 2003 and now experiencing rapid residential transformation. Beyond’s 8-million-square-foot masterplan represents the largest single private-sector commitment to DMC’s residential development.
- Current average PSF: AED 2,400–2,600 (Sensia phase saw prices 15–20% higher than Orise launch within weeks)
- Analyst projection: AED 4,000–5,000 PSF by 2028–2029 as district matures — implied appreciation of 50–100% from current off-plan prices
- Scarcity factor: Limited available waterfront plots in central Dubai; DMC offers sea views with Downtown proximity (15 min drive)
- Infrastructure: AED 1.5B Dubai Harbour expansion adjacent; metro connectivity planned in Dubai 2040 framework
- Short-term rental potential: Coastal location, proximity to cruise terminal, and branded amenities position DMC for 8–12% STR yields post-handover
Investment Recommendation — Beyond Developments
Beyond is best suited for capital appreciation investors with a 3–5-year horizon willing to accept early-stage district risk in exchange for deep off-plan discounts. The Omniyat parentage significantly de-risks execution. Orise and Saria (Phase 1) represent the best value given 15–20% price appreciation since initial launch. Hado on Dubai Islands offers the highest projected yield (8–10%) for income-focused investors at the most accessible entry price.
| Strategy | Best Project | Entry | Expected Yield | 5-yr Capital Upside | Risk Level |
| Capital Growth | Orise (DMC Phase 1) | AED 1.9M | 6–8% | 50–80% | Medium |
| High Yield | Hado (Dubai Islands) | AED 0.8M | 8–10% | 30–50% | Medium-High |
| Trophy Asset | Passo (Palm JBR) | AED 5.5M+ | 4.5–5.5% | 25–40% | Low-Medium |
| Commercial | 31 Above (DMC Office) | AED 4.5M+ | 7–9% | 40–60% | Medium |
| SECTION 3 — SELECT GROUP |
Developer Overview
Select Group is widely considered Dubai’s premier premium waterfront developer, with over 20 years of continuous delivery since its founding in 2002 by CEO Rahail Aslam. With a portfolio valued at AED 35.2 billion, 7,000+ homes delivered across 20 million square feet, and flagship projects including the globally recognised Six Senses Residences on Palm Jumeirah and the Peninsula waterfront community in Business Bay, Select Group represents the gold standard for investment-grade residential development in the UAE.
Developer Credentials
- Founded: 2002 | CEO: Rahail Aslam | Headquarters: Dubai, UAE
- Portfolio Value: AED 35.2 billion GDV (as of 2025)
- Units Delivered: 7,000+ across UAE and UK (98 Baker Street, 52 Avenue Road London)
- Current Pipeline: 10+ active projects across Dubai Marina, Business Bay, Maritime City, d3, Palm Jumeirah
- Specialisation: Premium waterfront towers and branded residences in prime Dubai locations
- Brand Partners: Six Senses (wellness), Jumeirah Living (hospitality), Woods Bagot (architecture, Artistry series)
- Awards: Multiple MIPIM, Arabian Property, and Cityscape International awards for quality and design
──────────────────────────────────────────────────────────────────────────────────────────
Complete Project Portfolio
Completed & Delivered Projects
| Project | Location | Delivered | Type | Price Range | Rental Yield | Appreciation |
| Marina Gate I | Dubai Marina | 2018 | Residential | AED 1.4M–4.5M | 7.2–8.8% | +65% since launch |
| Marina Gate II | Dubai Marina | 2019 | Residential | AED 1.4M–4.5M | 7.2–8.8% | +65% since launch |
| Jumeirah Living Marina Gate | Dubai Marina | 2020 | Serviced Apts | AED 2.5M–8M | 6.8–8.5% | +55% since launch |
| Studio One | Dubai Marina | 2018 | Residential | AED 600K–1.5M | 7.5–8.8% | +70% since launch |
| 15 Northside | Business Bay | 2022 | Residential | AED 1.2M–3.5M | 6.4–7.5% | +45% since launch |
| Peninsula Phase 1 | Business Bay | 2023 | Residential | AED 1.5M–6M | 6.1–6.8% | +40% since 2021 |
| Peninsula Phase 2 | Business Bay | 2024 | Residential | AED 1.5M–6M | 6.1–6.8% | +35% since 2021 |
| Peninsula Phase 3 | Business Bay | 2025 | Residential | AED 1.8M–7M | 6.1–6.8% | +30% since 2022 |
| Peninsula Five (Signature) | Business Bay | 2025 | Luxury Residential | AED 3M–15M | 5.5–6.5% | +50% since 2022 |
| Residence 110 | Business Bay | 2023 | Luxury Residential | AED 1.9M–4.3M | 6.0–7.0% | +35% since launch |
| No. 9 | Dubai Marina | Completed | Residential | AED 1.2M–4M | 6.5–7.5% | +50% since launch |
| 98 Baker Street | London, UK | Completed | Residential | GBP 600K–2.5M | 3.0–4.0% | +30% since launch |
Under Construction — Active Projects
| Project | Location | Handover | Progress | Starting Price | Payment Plan | Key Feature |
| Six Senses Residences Dubai Marina | Dubai Marina | 2026 | 81% | AED 8M+ | Custom | World’s first Six Senses Residences. Ultra-luxury. 4–7% yield, 85–90% cap. growth. |
| Six Senses Residences The Palm | Palm Jumeirah | 2026 | ~80% | AED 6M+ (PSF 6k–9k) | Custom | Beachfront wellness residences. Strong HNWI demand. 4.1–5.2% yield. |
| Peninsula Four | Business Bay | Mid-2026 | 68% | AED 2.5M+ | 50/50 | Waterfront plaza & towers. Canal views. Burj Khalifa proximity. |
| Jumeirah Living Business Bay | Business Bay | Q4 2025/2026 | 91% | AED 8.5M+ | 40/60 | 35-storey branded tower. 82 residences. 2–5BR. Canal & Burj views. |
| Nautica Phase 1 | Dubai Maritime City | Q4 2026 | 24% | AED 1.35M+ | TBC | 44-storey, 1–2BR waterfront. Bay views. AED 368K entry (USD equiv). |
| Nautica Phase 2 | Dubai Maritime City | Q4 2026 | 27% | AED 1.5M+ | TBC | Follow-on tower — same location. Strong projected yield 6–7.5%. |
| The Edge | Business Bay | 2026 | 42% | AED 1.2M+ | TBC | Canal-facing contemporary tower. Mid-market entry into BB. |
Newly Launched — Off-Plan (2025–2026)
| Project | Location | Handover | Starting Price | Payment Plan | Key Highlight |
| Artistry One Residences | Dubai Design District (d3) | Feb 2029 | AED 2.3M | 50/50 | Designed by Woods Bagot. 1–3BR + 4BR duplex penthouses. Creative hub location. |
| Artistry Two Residences | Dubai Design District (d3) | 2029 | AED 2.5M (est.) | 50/50 | Launched Feb 2026 after Artistry One sold strongly. 29-storey companion tower. |
| Residence 110 (new stock) | Business Bay | Delivered | AED 2.2M+ | 10/90 | Small inventory project. Ready to move in. Immediate rental income. |
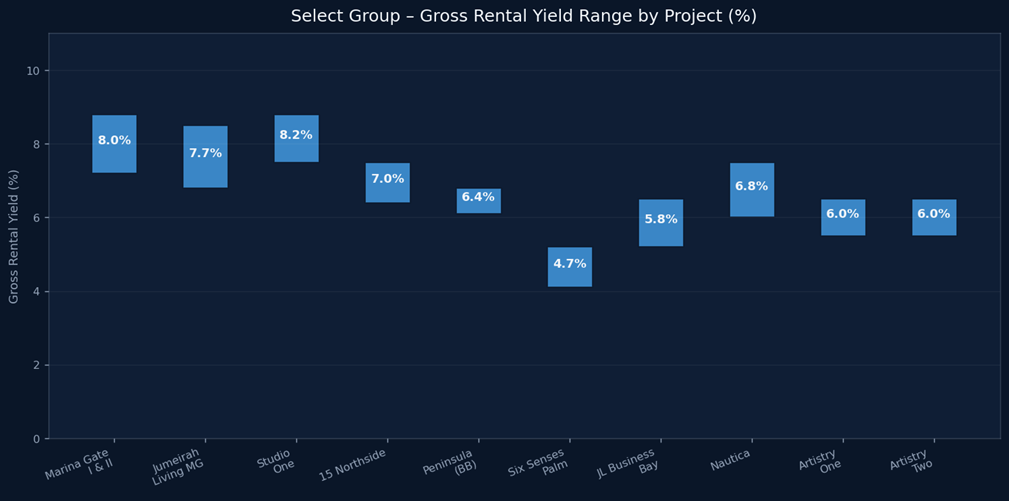
Figure: Select Group: Gross Rental Yield Range by Project (%)
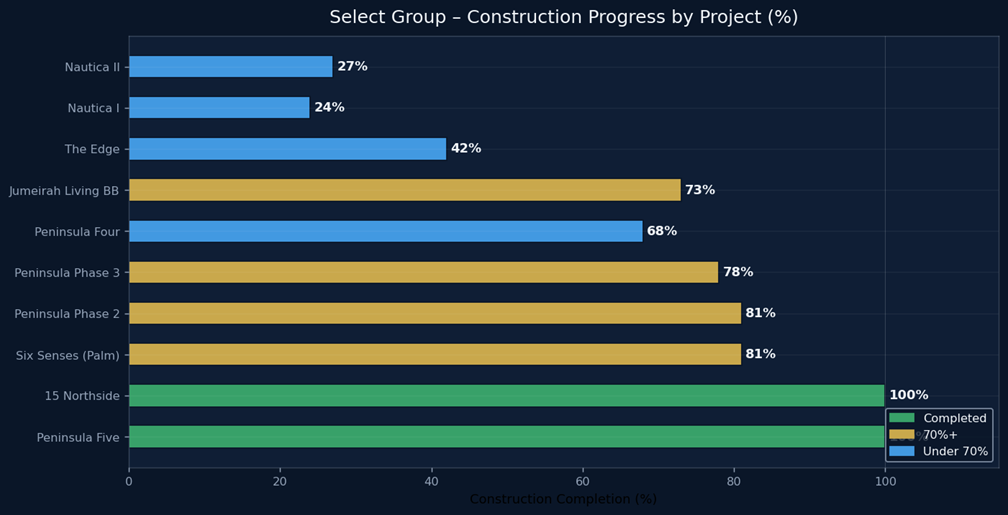
Figure: Select Group: Construction Progress by Active Project (%)
──────────────────────────────────────────────────────────────────────────────────────────
ROI & Performance Analysis — Select Group
| Project | Location | Gross Yield | Net Yield (est.) | 5-yr Appreciation | Total 5-yr Return | Status |
| Marina Gate I & II | Dubai Marina | 7.2–8.8% | 5.5–7.0% | +65% | ~100–115% | Delivered ✅ |
| Six Senses (Marina) | Dubai Marina | 5–7% | 3.5–5.5% | +85–90% | ~120–135% | Near handover |
| Six Senses (Palm) | Palm Jumeirah | 4.1–5.2% | 2.8–4.0% | +60–90% | ~90–115% | Near handover |
| Peninsula Towers | Business Bay | 6.1–6.8% | 4.5–5.5% | +40–72% | ~80–100% | Phases 1–5 |
| Jumeirah Living BB | Business Bay | 5.2–6.5% | 3.8–5.0% | +40–55% | ~70–88% | Q4 2025/2026 |
| 15 Northside | Business Bay | 6.4–7.5% | 4.8–6.0% | +45% | ~82–95% | Delivered ✅ |
| Studio One | Dubai Marina | 7.5–8.8% | 5.8–7.0% | +70% | ~110–122% | Delivered ✅ |
| Nautica (Maritime City) | Dubai Maritime City | 6.0–7.5% | 4.5–6.0% | +30–50% | ~60–88% | Under construction |
| Artistry One/Two (d3) | Dubai Design District | 5.5–6.5% | 4.0–5.0% | +35–55% | ~64–83% | Off-plan 2029 |
Investment Recommendation — Select Group
Select Group is the recommended choice for investors prioritising track record, brand quality, and bankable assets. Marina Gate and Six Senses have delivered category-leading capital appreciation. The Peninsula community in Business Bay remains the most liquid mid-market investment in this portfolio, with consistent 6–7% yields backed by strong occupancy from DIFC/Downtown professionals. Artistry in d3 targets the creative economy tenant base — an underserved segment with growing demand.
| SECTION 4 — SOL PROPERTIES |
Developer Overview
SOL Properties is a boutique luxury developer with a focused strategy centred on branded and ultra-luxury residential developments in Dubai’s most prestigious addresses. The developer is best known for the Fairmont Residences Solara Tower in Downtown Dubai — a collaboration with Accor’s Fairmont brand — and Ocean House on the Palm Jumeirah, a waterfront mansion-style project. SOL occupies a premium niche between large-scale developers and bespoke boutique operators.
Developer Credentials
- Headquarters: Dubai, UAE | Founded: 2010s (rebranded / expanded pipeline 2021–2025)
- Portfolio Focus: Ultra-luxury branded residences and premium waterfront apartments
- Key Brand Partnership: Fairmont Hotels & Resorts (Accor Group) for Solara Tower
- Active Pipeline: 7 projects ranging from AED 625K (Pearl House JVC) to AED 100M+ (ultra-luxury Downtown units)
- Target Investor: HNWI capital growth seekers (Fairmont, Ocean House) and yield-focused buyers (JVC, JVT portfolio)
- Payment Plans: Flexible — 5% booking to 20% DP; construction-linked plans available
- Geographic Spread: Downtown Dubai, Palm Jumeirah, JVT, Business Bay, Jumeirah Village Circle, SZR
──────────────────────────────────────────────────────────────────────────────────────────
Complete Project Portfolio
| Project | Location | Handover | Type | Entry Price | Payment Plan | Key Notes |
| Fairmont Residences Solara Tower | Downtown Dubai, near Burj Khalifa | Q4 2027 | Branded Luxury | AED 4.5M (studios from AED 2.8M) | Custom | 5* Fairmont brand. World-class amenities. 45-storey landmark. 5.7–7.0% yield. |
| Ocean House | Palm Jumeirah Crescent | Q2 2025 | Luxury Waterfront | AED 12M+ (beach mansions AED 40M+) | Custom | Private beach, sea views, mansions & sky villas. 4.0–5.5% yield. Trophy asset. |
| SOL Levante | Jumeirah Village Triangle (JVT) | 2025–2026 | Mid-Market Residential | AED 650K | 20% DP + 1%/month | 1–3BR incl. duplexes. Highest yield in portfolio 7.5–8.5%. Accessible entry. |
| SOL Luxe | Sheikh Zayed Road (SZR) | 2026–2027 | Premium Residential | AED 1.1M+ | TBC | Modern SZR corridor tower. Business/exec tenant base. 5.5–7.0% yield. |
| SOL Bay | Business Bay | 2026 | Residential | AED 900K+ | 10/50/40 | BB canal views. Mix 1–3BR. DIFC walkable. 6.0–7.5% yield. |
| SOL Terra Casa | Suburban Dubai | 2027 | Villa Community | AED 3.2M+ | 30/70 | Villas and townhouses in gated community. 7.0–8.5% yield. |
| Pearl House | Jumeirah Village Circle (JVC) | 2025 | Mid-Market | AED 625K | 10/90 | Small studios and 1BR. Fully handed over in 2025. 7.0–8.5% yield. |
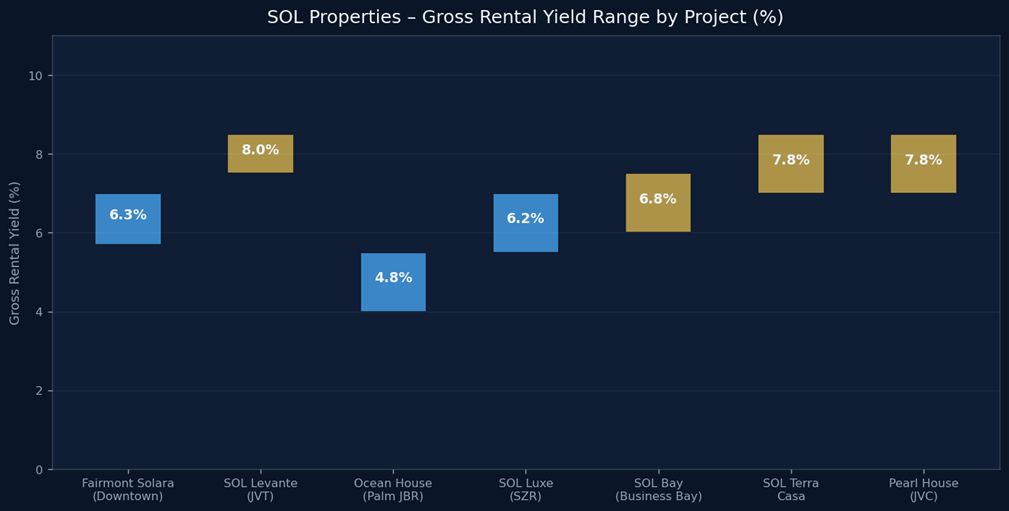
Figure: SOL Properties: Gross Rental Yield Range by Project (%)
──────────────────────────────────────────────────────────────────────────────────────────
Fairmont Residences Solara Tower — Deep Dive
The Fairmont Residences Solara Tower is SOL Properties’ most significant project and one of the most prestigious branded residential addresses in Downtown Dubai. Located a short walk from the Burj Khalifa and Dubai Mall, the tower offers direct access to the Dubai Fountain boardwalk and five-star Fairmont hotel services including concierge, spa, valet, and in-residence dining.
Key Metrics — Fairmont Solara Tower
| Metric | Detail |
| Location | Downtown Dubai — adjacent to Dubai Opera, 800m from Burj Khalifa |
| Height | 45 storeys | Iconic Downtown silhouette |
| Unit Mix | Studios, 1BR, 2BR, 3BR, sky villas and penthouses |
| Entry Price | AED 2.8M (studio) to AED 35M+ (penthouse) |
| Gross Yield | 5.7–7.0% (comparable Fairmont Downtown averages 7–8% STR) |
| Brand Management | Fairmont Hotels & Resorts (Accor) — globally recognised 5* operator |
| Hotel Services | Full Fairmont concierge, spa, F&B, valet, branded pool & gym |
| STR Premium | Branded hotel-managed units can command 30–40% STR premium over unbranded |
| Capital Appreciation | 8–12% annually projected 2025–2028 based on Downtown price trajectory |
| Investment Case | Permanent capital preservation + branded rental income + trophy address |
| Payment Plan | 10% booking / 40% construction / 50% handover (custom plans available) |
──────────────────────────────────────────────────────────────────────────────────────────
Ocean House — Deep Dive
Ocean House on the Palm Jumeirah is SOL’s ultra-luxury offering — a collection of sea-facing residences and beach mansions on the outer crescent of the Palm, one of the world’s most recognisable addresses. The project targets billionaire and ultra-HNWI buyers for whom Dubai represents a second or third home.
Key Metrics — Ocean House
| Metric | Detail |
| Location | Palm Jumeirah Crescent — north-facing sea views across the Arabian Gulf |
| Unit Type | Sea view apartments (2–4BR), sky villas, and beach mansions |
| Entry Price | AED 12M (apartments) to AED 100M+ (beach mansions) |
| Gross Yield | 4.0–5.5% (lower yield typical of ultra-luxury; primary capital preservation play) |
| Target Buyer | Global UHNWI, European, and Asian wealth — second home purchasers |
| STR Potential | AED 25,000–80,000/night (villa-level STR); managed through luxury rental agencies |
| Capital Upside | 30–50% appreciation expected 2025–2030 based on Palm Crescent comps |
| Comparable | Kempinski Emerald Palace Residences: AED 14K–22K PSF; Palm Crescent avg: AED 6K–8K PSF |
| Handover | Q2 2025 — already delivering; immediate rental income available |
Investment Recommendation — SOL Properties
SOL Properties suits two distinct investor profiles. For HNWI investors targeting capital preservation and brand prestige, Fairmont Solara Tower and Ocean House are best-in-class. For yield-maximising investors building an income portfolio, SOL Levante in JVT and Pearl House in JVC deliver the highest gross yields in SOL’s portfolio (7.5–8.5%) at accessible entry prices of AED 625K–800K. The mid-market segment projects have also shown consistent absorption and occupancy rates above 93%.
| SECTION 5 — DUBAI PROPERTIES (A DUBAI HOLDING COMPANY) |
Developer Overview
Dubai Properties is one of the most storied real estate developers in the UAE — a subsidiary of Dubai Holding, the diversified investment group chaired by Sheikh Mohammed bin Rashid Al Maktoum, Ruler of Dubai. With over 25 years of continuous operation, 40,000+ units across every major asset class, and master-planned communities housing hundreds of thousands of residents, Dubai Properties is a sovereign-backed asset with the lowest execution risk of any developer in this report.
Developer Credentials
- Parent: Dubai Holding — UAE government-linked conglomerate (owns 14+ major brands)
- Founded: Early 2000s | Operates as core residential delivery arm of Dubai Holding Real Estate
- Portfolio Value: AED 30B+ delivered; AED 20B+ pipeline
- Communities Developed: JBR, Business Bay Square, Mudon, Villanova, Serena, Remraam, Arjan, MJL, Madinat Jumeirah Living
- Asset Classes: Luxury waterfront, master-planned villas, affordable apartments, branded towers, retail
- Investor Profile: Conservative to moderate — prioritising capital safety, brand recognition, and rental income stability
- Government Backing: As a Dubai Holding entity, projects benefit from sovereign assurance of delivery and infrastructure commitment
──────────────────────────────────────────────────────────────────────────────────────────
Complete Project Portfolio — Current & Future
Flagship Delivered Communities
| Community / Project | Type | Location | Units | Status | Avg Yield | Notes |
| Jumeirah Beach Residence (JBR) | Mixed-use waterfront | JBR, Dubai Marina | 5,500+ apts | Fully delivered | 5.5–7.5% | The original Dubai waterfront; iconic lifestyle address. JBR Walk. |
| 1/JBR Tower | Ultra-luxury | JBR Beachfront | 143 ultra-luxury | Delivered 2021 | 5.5–7.5% | Dubai’s most prestigious branded address. AED 7K–12K PSF. |
| La Vie | Luxury waterfront | JBR / Jumeirah | Limited units | Delivered | 5.5–7.0% | Boutique waterfront tower adjacent to JBR beach. |
| Bay Square | Mixed commercial/resi | Business Bay | 2,500 units + office | Delivered | 6.5–8.0% | 9 residential & commercial buildings. 1–3BR, office suites. |
| Madinat Jumeirah Living (MJL) | Luxury community | Jumeirah Road | 2,000+ units | Delivered 2022 | 5.5–7.0% | Adjacent to Madinat Jumeirah 5* resort. Mediterranean feel. |
| Mudon | Villa community | Dubailand | 3,200 villas | Fully delivered | 4.5–5.5% | Family-oriented. 3–6BR villas. Strong school proximity. |
| Villanova | Townhouse community | Dubailand | 5,000+ units | Delivered | 5.0–6.0% | Well-run master community. 2–5BR TH & villas. |
| Serena | Townhouse community | Dubailand | 1,500+ units | Delivered | 5.0–6.0% | Spanish-Mediterranean design. 2–4BR. Resident-favourite. |
| Remraam | Affordable apartments | Dubailand | 2,000+ units | Delivered | 6.5–7.5% | Well-managed. Entry-level investment. Strong tenant demand. |
Under Construction — Active Projects
| Project | Community | Type | Handover | Entry Price | Payment Plan | Yield Expectation |
| Mudon Al Rayanah | Mudon Phase 3 | 4–6BR Villas | 2026–2027 | AED 3.2M+ | Post-handover 80/20 | 4.5–5.5% |
| Villanova Amaranta Phase 5 | Villanova | 3–4BR Villas & TH | 2026 | AED 1.8M+ | 60/40 post-handover | 5.0–6.0% |
| Villanova Casablanca Boutique | Villanova | 2–3BR TH | 2025–2026 | AED 1.4M+ | 60/40 | 5.5–6.5% |
| Serena La Rosa | Serena | 2–4BR TH | 2026 | AED 1.2M+ | Post-handover plan | 5.5–6.5% |
| Arjan Apartments | Arjan (Dubailand) | Studio–2BR | 2025–2026 | AED 450K+ | 40/60 | 6.5–8.0% |
| MJL Expansion | Madinat Jumeirah Living | 1–3BR | 2026–2027 | AED 1.8M+ | 50/50 | 5.5–7.0% |
| Greenway (undisclosed) | Community TBC | Villas | 2027+ | AED 4M+ | TBC | 4.5–5.5% |
Figure: Dubai Properties: Gross Rental Yield by Community (%)
──────────────────────────────────────────────────────────────────────────────────────────
1/JBR — Deep Dive
1/JBR (One at Jumeirah Beach Residence) is Dubai Properties’ single most prestigious project — a 72-storey ultra-luxury beachfront tower at the heart of JBR Walk. It represents the pinnacle of the developer’s portfolio and competes directly with Address Beach Resort Residences, Como Residences, and Muraba Palm as one of Dubai’s elite residential addresses.
| Metric | Detail |
| Location | JBR Beachfront — directly on 1.7km stretch of The Beach |
| Height / Floors | 72 storeys | One of the tallest residential towers on JBR |
| Unit Mix | 1–5BR + penthouse | 143 exclusive residences |
| Price Range | AED 7,000–12,000 PSF | AED 5M (1BR) to AED 120M+ (penthouse) |
| Gross Rental Yield | 5.5–7.5% | STR potential 8–12% (prime beach location) |
| Comparable PSF | Address Beach Resort Residences: AED 7K–10K PSF; Pier 8 Marina: AED 4K–5.5K PSF |
| Capital Appreciation | 8–12% annual appreciation 2021–2025; 30–50% cumulative since launch |
| Amenities | Infinity pool, private beach access, F&B, spa, concierge, parking |
| Investment Case | Ultra-liquid; strong resale market; permanent HNWI demand; UAE Golden Visa eligible |
Community Comparison — Dubai Properties Portfolio
| Community | Asset Type | Entry Price | Gross Yield | Best For | Risk Profile |
| 1/JBR | Ultra-luxury waterfront | AED 5M–120M | 5.5–7.5% | Trophy / Capital preservation | Very Low |
| JBR (standard) | Waterfront apartments | AED 1.5M–5M | 5.5–7.5% | Income + capital | Very Low |
| MJL | Luxury community apts | AED 1.8M–5M | 5.5–7.0% | Lifestyle / long-term rental | Low |
| Bay Square (BB) | Urban mixed-use | AED 750K–3M | 6.5–8.0% | Yield-focused investors | Low |
| Mudon Villas | Family villa community | AED 2.5M–8M | 4.5–5.5% | Long-term capital growth | Very Low |
| Villanova TH | Community townhouses | AED 1.2M–4M | 5.0–6.0% | Balanced income/capital | Very Low |
| Serena TH | Community townhouses | AED 1.1M–3.5M | 5.0–6.0% | Family rental demand | Very Low |
| Remraam | Affordable apartments | AED 400K–1.2M | 6.5–7.5% | High yield entry | Low |
| Arjan | Mid-market apartments | AED 450K–1.5M | 6.5–8.0% | Diversification/yield | Low |
Investment Recommendation — Dubai Properties
Dubai Properties is the lowest-risk developer in this report — government-backed delivery with 25+ years of no defaults, master-planned communities with established infrastructure, and a broad entry price range from AED 450K to AED 120M+. It is the anchor allocation for any conservative overseas investor. The recommended approach is a split between 1/JBR or MJL for capital preservation, Bay Square Business Bay for yield, and Villanova/Mudon for diversification into the family residential segment which benefits directly from Dubai’s school expansion and population growth goals under the Dubai 2040 plan.
| SECTION 6 — CROSS-DEVELOPER COMPARISON & INVESTMENT SCORECARD |
Developer Head-to-Head Comparison
| Criteria | Beyond Developments | Select Group | SOL Properties | Dubai Properties |
| Founded | 2024 | 2002 | 2010s (expanded 2021) | Early 2000s |
| Parent | Omniyat Group | Independent | Independent | Dubai Holding (Govt) |
| GDV / Pipeline | AED 12B+ | AED 35.2B | AED 8B+ | AED 50B+ (total) |
| Units Delivered | New (est. 2024) | 7,000+ | 1,200+ | 40,000+ |
| Active Projects | 10 | 10+ | 7 | 10+ |
| Price Range | AED 0.8M–25M+ | AED 600K–15M+ | AED 625K–100M+ | AED 400K–120M+ |
| Avg Gross Yield | 6.0–9.5% | 5.5–8.8% | 4.0–8.5% | 4.5–8.0% |
| Best Yield Project | Hado (8–10%) | Studio One (8.8%) | SOL Levante / Pearl House (8.5%) | Bay Square / Arjan (8.0%) |
| Capital Growth Potential | ★★★★★ | ★★★★★ | ★★★★☆ | ★★★★☆ |
| Track Record | ★★☆☆☆ | ★★★★★ | ★★★☆☆ | ★★★★★ |
| Government Backing | ★★★☆☆ | ★★★☆☆ | ★★★☆☆ | ★★★★★ |
| Branded Residence | No (commercial collab) | Yes (Six Senses, JL) | Yes (Fairmont) | No (1/JBR brand) |
| Payment Plan Flexibility | High | Medium–High | High | Medium |
| Entry Risk | Medium | Low | Low–Medium | Very Low |
| Investor Grade | Growth/Off-plan | Income + Growth | Trophy + Income | Conservative/Income |
Figure: Average Gross Rental Yield – All Four Developers (%)
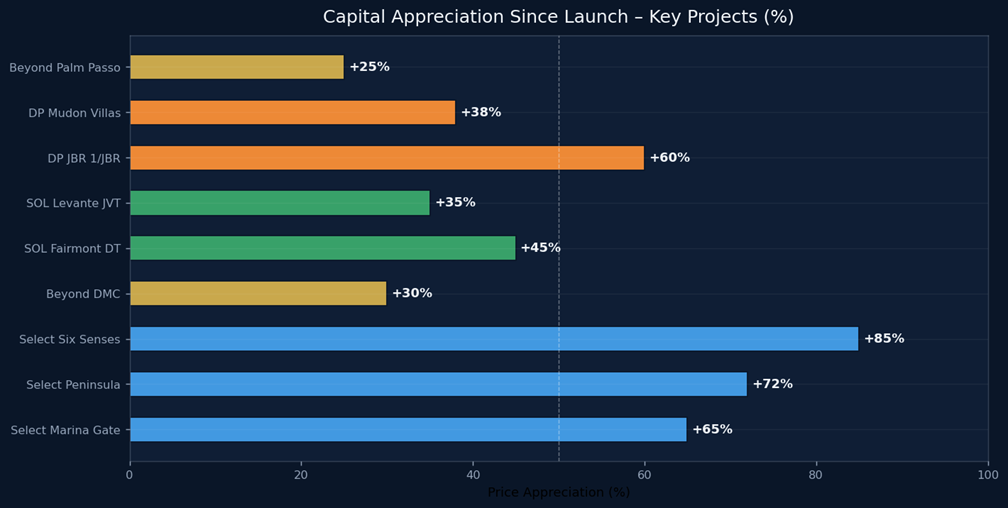
Figure: Capital Appreciation Since Launch – Key Projects (%)
Figure: Total Units Delivered to Date – Developer Track Record
──────────────────────────────────────────────────────────────────────────────────────────
Investor Risk-Return Matrix
The matrix below classifies each developer across two dimensions — risk appetite and investment objective — to guide allocation for a USD 10M portfolio.
| Investor Profile | Recommended Developer(s) | Allocation % | Rationale |
| Capital Preservation | Dubai Properties (1/JBR, MJL) | 30–40% | Government-backed; liquid market; 25yr track record |
| Yield Income | Select Group (Marina Gate, 15 Northside) | 25–30% | Proven 7–9% yields; delivered product; high occupancy |
| Capital Growth | Beyond Developments (Orise, Hado) | 20–25% | Off-plan at district pricing; 50–100% upside in 4 yrs |
| Branded Luxury | SOL Properties (Fairmont Solara, Ocean House) | 15–20% | Fairmont management; 5* hospitality yield premium |
| High Yield / Diversifier | Dubai Properties (Remraam/Arjan) + SOL (JVC) | 5–10% | 7.5–8.5% gross yields; accessible entry; tenant demand |
| SECTION 7 — DUBAI VS GLOBAL REAL ESTATE: YIELD & ROI COMPARISON |
Why Dubai Outperforms — Structural Advantages
- Zero capital gains tax — investors retain 100% of sale profit (vs 18–28% in UK, 20–37% in US, 26% in Germany)
- Zero personal income tax — rental income is 100% retained (vs 40–45% tax drag in UK, 30–37% in US)
- Zero inheritance / estate tax — full wealth transfer to heirs
- AED/USD peg since 1997 — eliminates currency risk for USD-denominated investors
- High gross-to-net yield ratio: Dubai’s net yield averages 5.2–6.1% vs gross 6.5–7.5%, a ~1.3–1.4% cost ratio, the lowest of all major markets profiled
- Free zone and mainland foreign ownership — 100% foreign freehold ownership in designated zones; no restrictions for overseas investors
20-Market Global Gross Yield Comparison
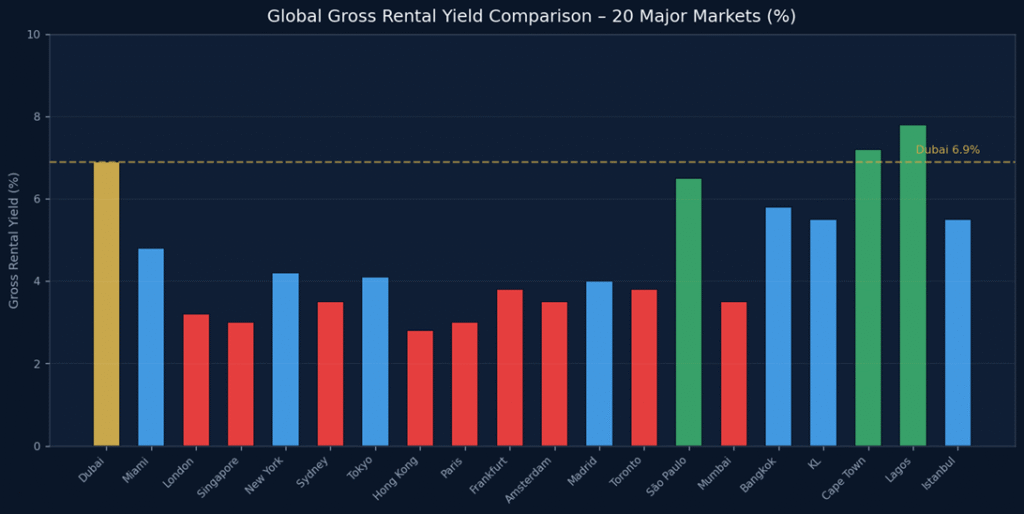
Figure: Global Gross Rental Yield Comparison — 20 Major Markets (%)
| City / Market | Country | Gross Yield | Net Yield (after tax) | Cap Gains Tax | Income Tax Rate | Property Tax / Annual Cost | Overall Investor Score |
| Dubai | UAE | 6.5–8.5% | 5.2–7.2% | 0% | 0% | ~0.5% service charge | ★★★★★ |
| Ras Al Khaimah | UAE | 7.0–9.5% | 5.5–8.0% | 0% | 0% | ~0.4–0.6% service | ★★★★★ |
| Lagos | Nigeria | 7.5–9.0% | 4.0–5.5% | 10% | 15–24% | High management cost | ★★★☆☆ |
| Cape Town | South Africa | 6.5–7.5% | 4.0–5.0% | 18% | 18–45% | Moderate | ★★★☆☆ |
| São Paulo | Brazil | 6.0–7.0% | 4.0–5.0% | 15–22% | 27% | High ITBI tax | ★★★☆☆ |
| Bangkok | Thailand | 5.5–6.5% | 3.8–4.5% | 0–3% | 5–35% personal | ~1.5% annual | ★★★★☆ |
| Kuala Lumpur | Malaysia | 5.0–6.0% | 3.5–4.5% | 0–30% (RPGT) | 0–30% | ~0.5–1.0% | ★★★☆☆ |
| Istanbul | Turkey | 5.0–6.5% | 3.5–4.5% | 15–25% | 15–35% | High inflation risk | ★★★☆☆ |
| Mumbai | India | 3.0–4.0% | 1.5–2.5% | 20–28% | 30% | Stamp duty 5–6% | ★★☆☆☆ |
| Madrid | Spain | 3.8–4.5% | 2.2–3.0% | 19–26% | 19–45% | IBI annual tax | ★★★☆☆ |
| Amsterdam | Netherlands | 3.2–4.0% | 2.0–2.8% | 30% box 3 tax | 30% | Gemeentelijke heffingen | ★★☆☆☆ |
| Frankfurt | Germany | 3.5–4.5% | 2.0–3.0% | 26% flat tax | 15–45% | Grundsteuer + Nebenkost | ★★★☆☆ |
| Toronto | Canada | 3.5–4.5% | 2.5–3.5% | 25–33% incl. Provincial | 20–33% | Land transfer tax + HST | ★★★☆☆ |
| Miami | USA | 4.5–6.0% | 2.8–4.0% | 20–37% | 22–37% Fed | Property tax ~1.5–2% | ★★★☆☆ |
| New York | USA | 4.0–5.5% | 2.5–3.5% | 20–37% | 22–37% Fed + NY State | Mansion tax; RE transfer | ★★☆☆☆ |
| Sydney | Australia | 3.2–4.0% | 2.0–2.8% | 25% (50% disc. for 1yr+) | 19–47% | Stamp duty + land tax | ★★☆☆☆ |
| Tokyo | Japan | 3.8–5.0% | 2.5–3.5% | 15–30% | 5–45% | Property tax ~1.4% | ★★★☆☆ |
| Singapore | Singapore | 2.8–3.5% | 1.8–2.5% | 0% (>3 yr hold) | 17% | ABSD 60% for foreigners! | ★★☆☆☆ |
| London | UK | 3.0–4.0% | 1.8–2.8% | 18–28% CGT | 20–45% | SDLT 2–17% + council tax | ★★☆☆☆ |
| Hong Kong | China SAR | 2.5–3.5% | 1.5–2.5% | 0% | 15% standard rate | Stamp duty 15–30% BSD | ★★☆☆☆ |
| Paris | France | 2.8–3.5% | 1.5–2.2% | 19–36% | 30% flat tax | Taxe foncière + habitation | ★★☆☆☆ |
──────────────────────────────────────────────────────────────────────────────────────────
10-Year Total Return Projection — Dubai vs Key Rivals
The table below models a USD 1M investment in residential real estate across six major markets, incorporating gross rental income, applicable taxes, and conservative capital appreciation assumptions.
| Market | Start Value | Annual Gross Rent | Annual Tax Drag | Annual Net Rent | 10-yr Appreciation | 10-yr Total Return | Annualised Return |
| Dubai (prime) | USD 1,000,000 | USD 70,000 | USD 5,000 (costs) | USD 65,000 | +80–100% | USD 1,450,000–1,650,000 | 15–22% CAGR |
| Dubai (mid-market) | USD 1,000,000 | USD 75,000 | USD 5,500 | USD 69,500 | +60–80% | USD 1,295,000–1,495,000 | 13–18% CAGR |
| Miami | USD 1,000,000 | USD 55,000 | USD 25,000 (35% tax) | USD 30,000 | +40–55% | USD 740,000–850,000 | 7–10% CAGR |
| London | USD 1,000,000 | USD 38,000 | USD 17,000 (45% tax) | USD 21,000 | +30–45% | USD 510,000–660,000 | 5–8% CAGR |
| Sydney | USD 1,000,000 | USD 37,000 | USD 18,000 (47% tax) | USD 19,000 | +35–50% | USD 540,000–690,000 | 5–8% CAGR |
| Singapore | USD 1,000,000 | USD 32,000 | USD 21,000 (60%+ ABSD) | USD 11,000 | +25–35% | USD 360,000–460,000 | 3–5% CAGR |
Note: Singapore figures assume foreign buyer — 60% ABSD makes gross yields sub-2.5% net. Dubai retains full gross yield as net yield (minus ~7–10% management/service costs only).
| SECTION 8 — USD 10 MILLION PORTFOLIO STRATEGIES |
Portfolio Construction Principles
A USD 10 million allocation to Dubai real estate provides sufficient scale to diversify across all four featured developers, multiple asset classes (waterfront luxury, branded residences, community villas, urban apartments), and a range of return objectives (income, growth, trophy). The following three portfolio blueprints present distinct strategies depending on investor priority.
Portfolio A — Maximum Yield (Target: 7.0–8.0% Gross Yield)
| Allocation | Developer | Project | Investment (USD) | % of Portfolio | Expected Gross Yield | Est. Annual Income |
| Allocation 1 | Select Group | Marina Gate / Studio One (2BR) | USD 2,000,000 | 20% | 7.5–8.8% | USD 150,000–176,000 |
| Allocation 2 | SOL Properties | SOL Levante JVT (2 units) | USD 1,000,000 | 10% | 7.5–8.5% | USD 75,000–85,000 |
| Allocation 3 | Dubai Properties | Bay Square Business Bay (2 units) | USD 1,200,000 | 12% | 6.5–8.0% | USD 78,000–96,000 |
| Allocation 4 | Dubai Properties | Remraam / Arjan (4 units) | USD 800,000 | 8% | 6.5–8.0% | USD 52,000–64,000 |
| Allocation 5 | Beyond Developments | Hado – Dubai Islands (3 units) | USD 1,200,000 | 12% | 8.0–10.0% | USD 96,000–120,000 |
| Allocation 6 | Select Group | The Edge / Nautica (2 units) | USD 1,200,000 | 12% | 6.0–7.5% | USD 72,000–90,000 |
| Allocation 7 | SOL Properties | Pearl House JVC (4 units) | USD 700,000 | 7% | 7.0–8.5% | USD 49,000–59,500 |
| Allocation 8 | Dubai Properties | Villanova / Serena TH (2 units) | USD 1,900,000 | 19% | 5.0–6.0% | USD 95,000–114,000 |
| TOTAL | — | — | USD 10,000,000 | 100% | 6.8–8.1% | USD 667,000–804,500 |
Portfolio B — Balanced Growth + Income (Target: 6.0–7.0% Yield + Capital Appreciation)
| Allocation | Developer | Project | Investment (USD) | % of Portfolio | Expected Gross Yield | Capital Growth Potential |
| Allocation 1 | Dubai Properties | 1/JBR (1BR luxury) | USD 2,500,000 | 25% | 5.5–7.5% | +35–50% (5yr) |
| Allocation 2 | Select Group | Six Senses Palm (1BR) | USD 1,800,000 | 18% | 4.1–5.2% | +60–90% (5yr) |
| Allocation 3 | Beyond Developments | Orise DMC (2 units) | USD 1,100,000 | 11% | 6.0–8.0% | +50–80% (5yr) |
| Allocation 4 | SOL Properties | Fairmont Solara Tower (1BR) | USD 1,400,000 | 14% | 5.7–7.0% | +40–60% (5yr) |
| Allocation 5 | Select Group | Peninsula Four BB (1BR) | USD 900,000 | 9% | 6.1–6.8% | +30–45% (5yr) |
| Allocation 6 | Dubai Properties | MJL (1–2BR, 2 units) | USD 1,200,000 | 12% | 5.5–7.0% | +25–40% (5yr) |
| Allocation 7 | Beyond Developments | 31 Above Office | USD 1,100,000 | 11% | 7.0–9.0% | +40–60% (5yr) |
| TOTAL | — | — | USD 10,000,000 | 100% | 5.5–7.1% | +40–65% capital growth |
Portfolio C — Trophy Assets (Preservation + Prestige)
| Allocation | Developer | Project | Investment (USD) | % of Portfolio | Expected Gross Yield | Notes |
| Allocation 1 | Dubai Properties | 1/JBR (3–4BR suite) | USD 4,500,000 | 45% | 5.5–7.5% | Flagship trophy; sovereign-backed address; instant liquidity |
| Allocation 2 | SOL Properties | Ocean House Palm (2BR villa) | USD 3,000,000 | 30% | 4.0–5.5% | Ultra-luxury; AED 80,000+/night STR; permanent capital |
| Allocation 3 | Select Group | Six Senses Marina (1BR) | USD 2,500,000 | 25% | 5.0–7.0% | World-first Six Senses; 85–90% cap appreciation since launch |
| TOTAL | — | — | USD 10,000,000 | 100% | 5.0–6.5% | Conservative, high-capital-preservation, lifestyle-driven |
──────────────────────────────────────────────────────────────────────────────────────────
Short-Term vs Long-Term Rental Comparison
Dubai permits both short-term (STR / holiday home / Airbnb) and long-term residential rentals. The table below guides optimal rental strategy per developer/project type.
| Project Type | Recommended Rental Mode | Avg Gross STR Yield | Avg Gross LTR Yield | STR Mgmt Cost | LTR Mgmt Cost | Optimal Strategy |
| JBR / 1/JBR (beachfront) | STR (holiday home) | 9–14% | 5.5–7.5% | 20–25% | 8–10% | STR for units <2BR; LTR for 3BR+ families |
| Six Senses (branded) | Hotel-managed / STR | 8–12% | 4.1–5.2% | 25–30% (operator) | N/A | Let operator manage — hotel yield > LTR |
| Fairmont Solara (branded) | Hotel-managed / STR | 7–10% | 5.7–7.0% | 20–25% | 8% | STR preferred given Fairmont premium pricing |
| Ocean House (Palm) | Ultra-luxury STR | 10–18% (villa) | 4.0–5.5% | 25–30% | 10% | STR for highest income — villa nights AED 30K+ |
| Peninsula BB / 15 Northside | LTR | 6.0–7.5% | 6.1–7.5% | 8–10% | 8% | LTR preferable — low STR demand vs Marina |
| SOL Levante / Pearl House | LTR | 6.5–7.5% | 7.5–8.5% | 10–12% | 8% | LTR: stable demand from mid-market tenants |
| Beyond Orise / DMC | LTR post-handover | 7–9% (waterfront) | 6.0–8.0% | 12–15% | 8% | DMC waterfront = strong STR potential (new) |
| Mudon / Villanova Villas | LTR (family) | 3.5–4.5% | 4.5–5.5% | 8% | 8% | LTR only — families prefer annual contracts |
| SECTION 9 — LEGAL, REGULATORY & ACQUISITION FRAMEWORK FOR OVERSEAS INVESTORS |
Foreign Ownership Rights
Dubai offers one of the most liberal foreign property ownership frameworks in the MENA region. Overseas investors can purchase freehold properties in all designated “freehold zones” with 100% ownership rights, no local partner requirement, and full title deed issued in the investor’s name by the Dubai Land Department (DLD).
Key Freehold Zones (All developers featured are located within these zones):
- Dubai Marina, JBR — Select Group, Dubai Properties
- Business Bay — Select Group, Dubai Properties, SOL Properties
- Downtown Dubai — SOL Properties (Fairmont Solara)
- Dubai Maritime City — Beyond Developments, Select Group (Nautica)
- Palm Jumeirah — SOL Properties (Ocean House), Select Group (Six Senses), Dubai Properties
- Jumeirah Village Circle / Triangle — SOL Properties
- Dubailand (Mudon, Villanova, Serena) — Dubai Properties
- Dubai Islands — Beyond Developments (Hado)
- Ras Al Khaimah (Al Marjan Island) — Beyond Developments (Le Château) [technically RAK freehold zone]
- Dubai Design District (d3) — Select Group (Artistry)
Transaction Costs — Full Cost of Acquisition (USD 1M Property)
| Cost Item | Rate / Amount | On USD 1M Property | Notes |
| DLD Transfer Fee | 4% of purchase price | USD 40,000 | Mandatory. Paid to Dubai Land Department on transfer. |
| DLD Admin Fee | AED 4,000 (approx) | USD 1,090 | Fixed fee per transaction. |
| Trustee / Conveyancing Fee | AED 4,000–10,000 | USD 1,090–2,720 | For off-plan: ~AED 4,000 to developer trustee. |
| NOC Fee (Resale) | AED 500–5,000 | USD 140–1,360 | Required from developer for resale. Not applicable on off-plan. |
| Mortgage Registration (if financed) | 0.25% of loan amount | USD 625 (on USD 250K loan) | Plus AED 290 admin fee. |
| Real Estate Agent Commission | 2% (standard) | USD 20,000 | Buyer typically pays 2% on resale transactions. |
| OQOOD Registration (off plan) | AED 3,010 | USD 820 | Off-plan initial registration with DLD (Ejari equivalent). |
| Annual Service Charge | 0.5–3.0% of value | USD 5,000–30,000/yr | Varies by community. Marina, downtown: AED 15–35/sqft. |
| TOTAL ACQUISITION COST | ~6–8% upfront | USD 63,000–85,000 | One-time, then ongoing service charge only. |
UAE Golden Visa — Real Estate Pathway
Foreign real estate investors in Dubai are eligible for the UAE Golden Visa (10-year renewable residence), which provides long-term residency rights, free zone business activity, and full access to UAE banking, healthcare, and education. The Golden Visa is one of the most powerful demand drivers in the Dubai market — over 120,000 Golden Visas were issued in 2023–2024.
| Visa Type | Property Value Requirement | Processing Time | Eligibility | Annual Cost |
| Golden Visa (Standard) | AED 2M (USD 545K) — property must be completed | 20–30 business days | Foreign nationals of any nationality | AED 10,000–15,000 (renewal every 10 yrs) |
| Golden Visa (Off-Plan) | AED 2M committed off plan (with developer certificate) | 30–45 business days | Foreign nationals with off-plan contract | AED 10,000–15,000 |
| Long-Term Residence Visa | AED 1M property value (5-year visa) | 15–25 business days | Property owners across UAE | AED 5,000–8,000 |
| Investor Visa (Business) | AED 10M+ total investment (or AED 10M business) | Custom / Priority | HNWI / Business investors | AED 10,000+ (2-year initially) |
Off-Plan vs Ready Property — Investor Framework
| Factor | Off-Plan (Under Construction) | Ready / Completed |
| Entry Price | 15–30% below market (developer pricing) | Market rate — full value |
| Capital Appreciation | 30–100% by handover (typical in Dubai) | 5–15% annually (mature market) |
| Rental Income | None until handover (2–4 years) | Immediate from day 1 |
| Payment Plan | Staged (5–50% book; 10/40/50 common) | Full payment or mortgage |
| Risk | Construction risk + market risk | Lower risk — product exists |
| Due Diligence | Escrow account (RERA mandated); developer track record | Title deed, Ejari, service charge history |
| Mortgage | Not available until handover | UAE banks lend 50–80% LTV for foreigners |
| Developer Incentive | Often includes DLD fee waiver (saves 4%) | No incentive — standard market terms |
| Best For | Growth investors (3–5yr horizon) | Income investors (immediate yield) |
| Leading Example | Beyond Orise, Select Artistry, SOL Levante | Select Marina Gate, DP 1/JBR, DP Bay Square |
| SECTION 10 — DUBAI 2040 URBAN MASTER PLAN & REAL ESTATE IMPLICATIONS |
Plan Overview
The Dubai 2040 Urban Master Plan, launched by Sheikh Mohammed bin Rashid Al Maktoum in 2021, is the most ambitious urban planning framework in Dubai’s history — a 20-year blueprint to accommodate a projected population of 5.8 million by 2040 (from ~3.6 million in 2021). The plan designates five urban centres, significantly expands protected natural and green space, and directly determines where investment in residential, commercial, and hospitality real estate will yield the highest long-term returns.
Five Urban Centres — Impact on Featured Developers
| Urban Centre | Role | Population Target | Key Projects (Our Developers) | Investment Implication |
| Deira & Bur Dubai (Heritage Centre) | Cultural, tourism & heritage hub | 850,000+ | DP communities in Historic Dubai areas | Moderate: gentrification upside; lower entry |
| Downtown Dubai & Business Bay (Creative Centre) | CBD, arts, lifestyle, DIFC | 750,000+ workers/residents | SOL Fairmont Solara; Select Group (Peninsula, 15 Northside, Artistry d3) | ★★★★★: Highest long-term capital growth corridor |
| Dubai Marina & JBR (Beach/Tourism Centre) | Waterfront lifestyle, tourism, hospitality | 500,000+ residents | Select Group (Marina Gate, Six Senses); DP (1/JBR, JBR) | ★★★★★: Permanent premium; constrained land supply |
| Dubai Silicon Oasis & Academic City (Knowledge Centre) | Tech, education, innovation hub | 300,000+ jobs | DP adjacent communities (Remraam, Arjan) | ★★★★☆: Long-term growth as tech economy matures |
| Expo City & South Dubai (Environmental Centre) | Sustainability, smart city, Expo legacy | New urban node under development | No featured developer active here yet | ★★★☆☆: Long-term; 2030+ upside |
Dubai 2040 — Key Infrastructure Commitments Affecting Our Developers
- Public transport expansion: Metro Blue Line connecting Dubai Marina to Academic City — benefits Select Group (Marina) and DP (Remraam/Arjan)
- Dubai Harbour development: AED 1.5B expansion adjacent to Beyond Developments’ Dubai Maritime City masterplan — catalyst for DMC district appreciation
- Dubai Islands mega-project: AED 60B+ development of 5 artificial islands in Deira — directly benefits Beyond’s Hado project on Siora Island
- Wynn Al Marjan Island (RAK): USD 5.1B integrated resort opening 2027 — major catalyst for Beyond’s Le Château and all RAK properties
- Madinat Jumeirah Living expansion: More phases approved — underpins DP MJL investment thesis
- D3 (Dubai Design District) densification: Creative zone expanded with more residential and commercial — tailwind for Select Group’s Artistry series
- Nature and green space: 60% of Dubai land designated as parks/natural reserves — restricts future supply, supporting price floors in established communities
- Population target (5.8M by 2040): Requires 550,000+ new residential units — guarantees sustained developer pipeline demand for 15+ years
2040 Plan: Supply Constraints = Price Floors for Existing Communities
A critical — often underappreciated — implication of Dubai 2040 is the restriction on development in established areas. By designating 60% of total land as nature/agriculture and the plan’s five urban centres as bounded growth zones, future new supply in JBR, Downtown, Business Bay, Dubai Marina, and Palm Jumeirah is severely constrained. This is the mechanism that drives sustained price appreciation in all four featured developers’ core locations.
| SECTION 11 — RISK ASSESSMENT & MITIGATION FRAMEWORK |
Market-Level Risks
| Risk Factor | Level | Probability | Impact | Mitigation Strategy |
| Oversupply (new units entering market) | Medium | Medium | Price softening; yield compression | Focus on established prime areas; choose scarcity zones (JBR, Marina, Downtown) |
| Global recession / oil price shock | Low–Medium | Low | Reduced demand; capital flight | Dubai non-oil GDP now 97.5% of total; diversified economy reduces oil linkage |
| Geopolitical instability in MENA | Low | Low | Investor sentiment risk | Dubai typically benefits from MENA instability as safe-haven capital flows in |
| Currency risk (AED) | Very Low | Very Low | No material risk | AED pegged to USD at 3.67 since 1997 — zero FX risk for USD investors |
| Regulatory change (foreign ownership) | Very Low | Very Low | Political risk | Dubai Holding entities (DP) are sovereign — no ownership law reversals expected |
| Developer insolvency / non-delivery | Low–High (varies) | Low for rated developers | Capital at risk; construction halt | Use RERA-registered escrow; choose proven developers (Select, DP lowest risk) |
| Interest rate impact on mortgage market | Low | Medium (2025–2027) | Reduced buyer pool | Cash buyers unaffected; strong rental demand buffers yield |
Developer-Specific Risk Ratings
| Risk Dimension | Beyond Developments | Select Group | SOL Properties | Dubai Properties |
| Delivery Risk | ★★★☆☆ (new developer) | ★★★★★ (20yr track) | ★★★★☆ (established) | ★★★★★ (govt. backed) |
| Financial Stability | ★★★★☆ (Omniyat parent) | ★★★★★ (AED 35B GDV) | ★★★★☆ | ★★★★★ (Dubai Holding) |
| RERA Compliance | ★★★★★ (mandatory escrow) | ★★★★★ | ★★★★★ | ★★★★★ |
| Title Transfer Risk | ★★★☆☆ (new districts) | ★★★★★ | ★★★★☆ | ★★★★★ |
| Exit Liquidity | ★★★☆☆ (emerging market) | ★★★★★ (deep market) | ★★★★☆ | ★★★★★ (JBR = most liquid) |
| OVERALL RISK SCORE | Medium | Low | Low–Medium | Very Low |
Investor Due Diligence Checklist
- Verify developer RERA registration number at DLD.gov.ae / RERA portal
- Confirm escrow account — RERA requires all off-plan payments into a project-specific DLD escrow account; payments direct to developer (not escrow) are a red flag
- Check developer’s OQOOD registration status for off-plan units
- Review building completion certificate (for ready properties) — issued by Dubai Municipality
- Obtain Ejari tenancy registration (mandatory for all rentals) — register at Ejari.gov.ae
- Use a RERA-licensed brokerage and verify agent RERA card number
- Engage a local conveyancing lawyer for AED 5M+ transactions
- Confirm Title Deed number and ownership history through DLD for resale properties
- Verify service charge history and pending maintenance fees from MOLLAK system (DLD)
- For branded residences (Fairmont, Six Senses): review hotel management agreement terms — operators typically take 30–45% of gross rental revenue
| SECTION 12 — DUBAI MARKET FUNDAMENTALS & CLOSING INVESTMENT CASE |
Dubai Real Estate Market: Historical Performance 2020–2026
| Year | Transactions (Volume) | Total Value (AED B) | Avg Price PSF (AED) | YoY Growth (Value) | Key Events |
| 2020 | 35,421 | AED 46.5B | AED 1,021 | −18% | COVID-19. Market trough. Distressed buying opportunity emerged Q3/Q4. |
| 2021 Q1–Q2 | 21,190 (H1) | AED 30.2B (H1) | AED 1,052 | +20% (H1 YoY) | Vaccine rollout. EXPO 2020 prep. Off-plan demand surge. |
| 2021 Full Year | 60,618 | AED 151B | AED 1,102 | +71% | Mega-recovery year. Billionaire HNWI inflows began. |
| 2022 Full Year | 86,854 | AED 255B | AED 1,338 | +69% | Record year. Palm, Marina, Downtown hit new highs. Golden Visa reform. |
| 2023 Full Year | 112,400 | AED 411B (inc. mortgages) | AED 1,480 | +61% | All-time record transactions. Off-plan 67% of sales. |
| 2024 Full Year | ~179,000 | AED 522B | AED 1,580 | +27% | Highest ever — AED 1.4B+ per day average. 40,000+ units launched. |
| 2025 Full Year | ~195,000 | AED 100.5B* (H1 at AED 52B) | AED 1,640 | Continued growth | *2025 full-year tracking to AED 100B+. Continued HNWI inflows. |
| 2026 YTD (Q1) | Market active | Strong pipeline | AED 1,680 est. | Stable | Off-plan dominance continues. Beyond, Select, SOL all active launches. |
*Note: Transaction values reflect DLD data; H1 2025 data from CBRE, Knight Frank and JLL quarterly reports. 2025 full-year projections based on H1 run rate.
Population & Demand Drivers
- Dubai population: 3.65 million (2024) — target 5.8 million by 2040 (59% growth needed)
- Net migration to Dubai: 110,000+ annual net inflow (2023–2025 average)
- HNWI inflows: Dubai attracted 6,700+ millionaires in 2023 — #1 globally (Henley Private Wealth Migration Report)
- Expatriate composition: 89% expatriate, 11% UAE nationals — permanent high-rental-demand structure
- Residential vacancy rate: 3–5% in prime areas (JBR, Marina, Downtown, Palm) — near full occupancy
- Average household size declining: 3.8 → 2.8 over 10 years — creates additional household formation demand
Why Now Is an Optimal Entry Point (2026)
- Off-plan launches are high, but absorption is matching supply — DLD data shows off-plan sell-through rates above 85% in Q4 2025
- Interest rates expected to decline in 2025–2026 (Fed easing cycle) — reduces UAE mortgage rates; broadens buyer pool
- Expo City Dubai transitioning to permanent innovation hub — new demand centre in South Dubai forming
- Wynn Al Marjan RAK opening 2027 — creating the first integrated resort in the Arab world, driving 20–30% RAK appreciation (Beyond Le Château beneficiary)
- D3 maturation accelerating with Artistry launches — Select Group’s creative district pivot captures emerging demand from tech/creative workforce
- Beyond’s DMC masterplan is pre-Phase 1 pricing — earliest off-plan buyers have already seen 15–20% appreciation within 12 months of launch
──────────────────────────────────────────────────────────────────────────────────────────
Closing Investment Case
Dubai in 2026 presents a convergence of structural demand tailwinds, zero-tax advantage, currency stability, and a world-class developer ecosystem. The four developers profiled — Beyond Developments, Select Group, SOL Properties, and Dubai Properties — collectively represent the full spectrum of the investment-grade Dubai market: from sovereign-backed mega-communities (DP) to branded ultra-luxury (SOL Fairmont), proven premium waterfront (Select Group), and high-growth off-plan (Beyond DMC). For a USD 10 million overseas investor, this market offers the combination of attributes found in no other global city: institutional delivery quality, 6–9% gross yields, zero tax drag, AED/USD peg stability, and a government committed to 20-year infrastructure and population growth planning that guarantees long-term demand.
──────────────────────────────────────────────────────────────────────────────────────────
DISCLAIMER: This report is prepared for informational purposes only and does not constitute investment advice, a solicitation, or a recommendation to buy or sell any specific property or financial instrument. All yield and appreciation figures are based on market research, developer information, and third-party data sources as at Q1 2026. Actual returns may differ materially. Prospective investors should conduct their own due diligence and consult with licensed UAE real estate professionals and legal advisors before committing capital. Currency: USD/AED 3.67.