
- April 23, 2026
- 4
- Real Estate
INVESTMENT REPORT 2026
Comprehensive Market Analysis for the USD 10 Million Overseas Investor
Historical Analysis 2020–2026 · Dubai 2040 Urban Master Plan
Global ROI & Yield Comparisons · Developer Profiles · Strategy
| Prepared For International HNWI / Institutional Investors | Reference Period 2020–2026 | Projections to 2040 | Currency AED 3.67 = USD 1.00 (Fixed Peg) |
This document is prepared for informational purposes only. Data sourced from Dubai Land Department, Knight Frank, REIDIN, DXB Analytics, Bayut, DarGlobal, Engel & Völkers, Global Property Guide, and RWInvest. Past performance is not indicative of future results. Investors should seek independent legal and financial advice before committing capital.
01 EXECUTIVE SUMMARY
Dubai has transformed from a regional real estate market into one of the most dynamic and liquid property investment destinations on earth. Between 2020 and 2025, annual transaction volume grew by 546% — from 33,279 deals worth AED 69.4 billion to 215,060 deals worth AED 682.6 billion — a trajectory unmatched by any comparable global market in the same timeframe.
For a USD 10 million investor, Dubai presents a rare convergence: gross rental yields of 6–9.3%, zero property tax, zero capital gains tax, zero income tax on rental proceeds, strong capital appreciation, and full freehold ownership rights for foreign nationals in designated zones. The AED is pegged to the USD at 3.67 — eliminating currency risk for USD-denominated investors.
The structural growth story is underpinned by the Dubai 2040 Urban Master Plan, the Dubai Economic Agenda D33 (targeting GDP doubling by 2033), and the UAE Centennial 2071 vision — together committing hundreds of billions in infrastructure and targeting 5.8 million residents by 2040, nearly double the current population.
Key Investment Highlights at a Glance
- 546% — Transaction volume growth 2020–2025 (33,279 → 215,060 deals)
- AED 682.6B — Total market value in 2025 — highest in Dubai’s history
- 6.7–9.3% — Gross rental yields across leading Dubai communities
- 0% — Property tax | Capital gains tax | Income tax on rental proceeds
- USD 545K — Minimum property value qualifying for 10-year Golden Visa residency
- 9,800 — Net new millionaires attracted to UAE in 2025 — #1 globally
- 206% — Villa price appreciation since pandemic low (Q1 2020 → Q1 2026)
- 5.8M — Target residential population by 2040 (Dubai 2040 Urban Master Plan)
- AED 650B — Infrastructure investment committed via D33 agenda through 2033
- 4 Million — Dubai’s current population — fastest-growing major global city
02 HISTORICAL MARKET ANALYSIS 2020–2026
2.1 Annual Transaction Data Summary
| Year | Transactions | Value (AED B) | Value (USD B) | YoY Txn Δ | YoY Value Δ | Avg Apt AED/sqft | Avg Villa AED/sqft |
| 2020 | 33,279 | AED 69.4B | USD 18.9B | — | — | ~955 | ~1,050 |
| 2021 | 59,507 | AED 148.6B | USD 40.5B | +78.8% | +114.1% | ~1,020 | ~1,200 |
| 2022 | 95,732 | AED 262.7B | USD 71.6B | +60.9% | +76.8% | ~1,190 | ~1,800 |
| 2023 | 132,260 | AED 408.7B | USD 111.4B | +38.1% | +55.6% | ~1,340 | ~2,050 |
| 2024 | 179,756 | AED 520.2B | USD 141.7B | +35.9% | +27.3% | ~1,530 | ~2,220 |
| 2025 | 215,060 | AED 682.6B | USD 186.0B | +19.6% | +31.2% | ~1,720 | ~2,350 |
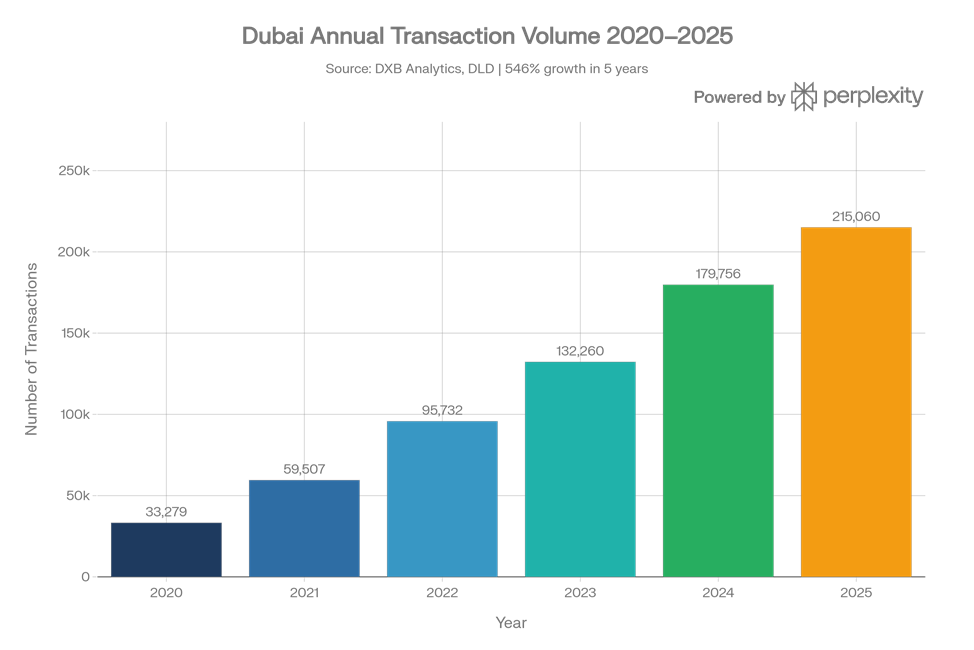
Figure 1: Dubai Annual Transaction Volume 2020–2025 | Source: DXB Analytics, Dubai Land Department
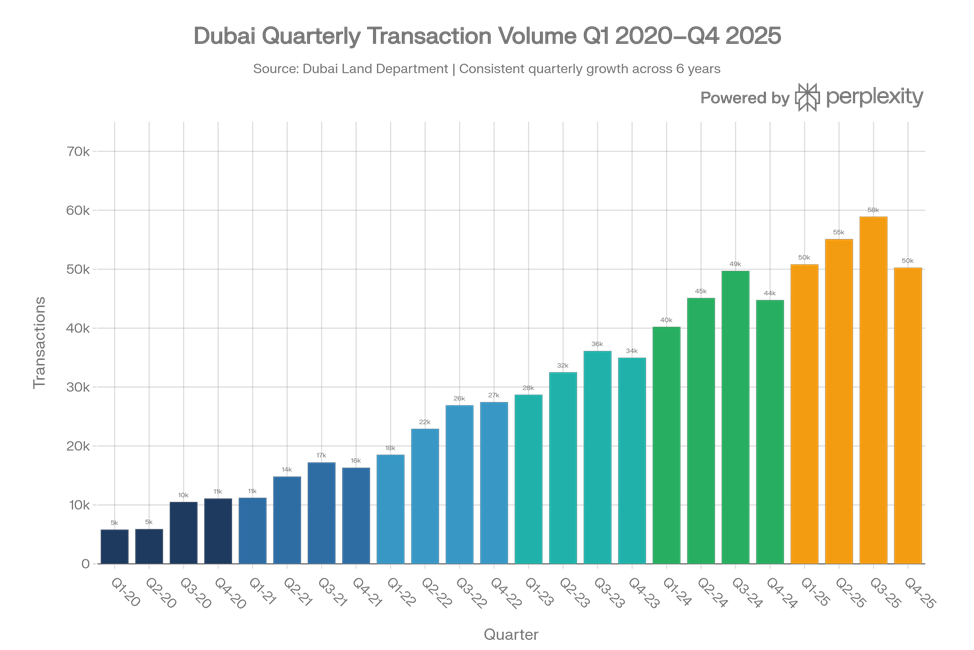
Figure 2: Dubai Annual Transaction Value (AED Billions) 2020–2025 | Source: DXB Analytics
Figure 3: Dubai Quarterly Transaction Volume Q1 2020–Q4 2025 | Source: Dubai Land Department
2.2 Year-by-Year Narrative
2020 — Pandemic Shock and Early Recovery
Total annual sales reached just 33,279 transactions worth AED 69.4 billion — the lowest volume in over a decade. COVID-19 caused Q2 near-paralysis; international travel restrictions cut off the buyer base. The Dubai government responded swiftly: visa reforms were expedited, digital sales processes were implemented, and the Golden Visa programme was rapidly expanded. The UAE’s global leadership in vaccine rollout — one of the fastest in the world — restored international confidence and mobility by early 2021, laying the groundwork for an explosive recovery.
2021 — The Re-Rating Begins (+79% transactions, +114% value)
2021 marked the beginning of one of the most remarkable property expansions in modern market history. Transaction volumes surged to 59,507 deals (+78.8%) worth AED 148.6 billion (+114%). Expo 2020 Dubai (October 2021–March 2022) acted as a global advertisement for the city; long-term visa reforms attracted international talent; Dubai’s tax-free structure drew high-net-worth individuals from Russia, India, UK, and Europe. Villa and townhouse communities saw 40–60% price appreciation between early 2020 and late 2022.
2022 — Sustained Momentum at Scale (+61% transactions, +77% value)
The surge continued into 2022, with transaction volumes growing a further 60.9% to 95,732 deals worth AED 262.7 billion. By year-end 2022, apartment prices had risen 22% year-on-year while villa prices surged 45% — the fastest appreciation ever recorded in the Dubai residential market. Foreign investment inflows hit record highs as wealthy individuals from across the globe re-evaluated residency options. Developers responded by launching record numbers of off-plan projects, absorbing demand that outstripped ready supply.
2023 — Strategic Consolidation (+38% transactions, +56% value)
132,260 deals worth AED 408.7 billion — the highest annual value at that time. The off-plan segment rose to 55% of all deals. Sales of $10M+ homes reached 434 transactions for the full year, rivalling the combined figures of London and New York in the same period. The luxury segment proved the most resilient: Palm Jumeirah transacted over $2 billion in super-prime homes; penthouses and branded residences in Downtown sold faster than at any time in Dubai’s history.
2024 — Year of Records (+36% transactions, +27% value)
179,756 transactions (+35.9%) worth AED 520.2 billion. Emaar Development’s property sales alone reached AED 65.4 billion — a 75% year-on-year increase. 435 homes sold above $10 million, making Dubai the world’s busiest market for super-prime residential sales for the second consecutive year. Palm Jumeirah recorded 127 such transactions worth nearly $2.3 billion. Villa values rose 20.2%, representing a 99.8% uplift versus Q1 2020 levels. The Prime Price Index rose to 21% above its 2014 cyclical peak.
2025 — Another All-Time High (+20% transactions, +31% value)
Total sales reached AED 686.8 billion across 215,736 transactions. Off-plan transactions rose to 70.2% of all residential deals in H1 2025. Apartment prices registered a 15.22% annual increase; villa prices rose 17.81%. Dubai’s population crossed 4 million, adding fundamental housing demand. In H1 2025 alone, 94,700 investors contributed AED 326 billion — a 22% rise in net-new investor entries year-on-year. Average apartment price crossed AED 1,700/sqft; villas averaged AED 2,350/sqft.
2026 Year-to-Date — Measured Continuation (Forecast +4–6% prices)
As of April 2026, the market is entering a more measured phase after five consecutive years of double-digit growth. January 2026 recorded 16,996 transactions — a 20% year-on-year increase, confirming sustained momentum. Most forecasters project 4–6% price appreciation for 2026 — a normalisation rather than reversal. The Dynamic Price Index remains approximately 20.3% above the 2014 peak. Approximately 131,234 new units are in the 2026 pipeline, though historical data consistently shows actual handovers lag announced launches by 30–50%, limiting supply-side shock.
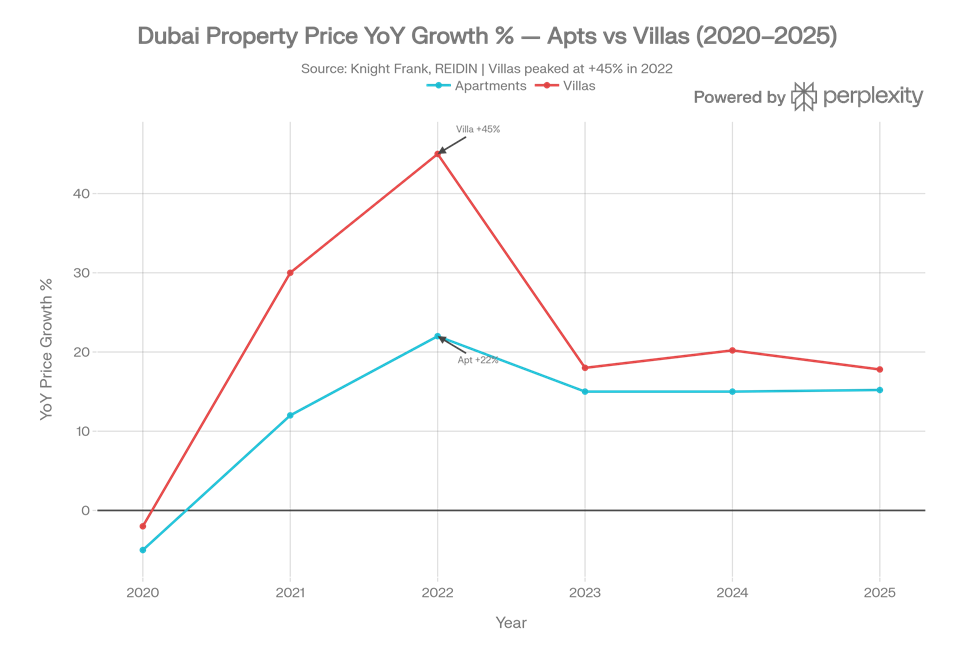
Figure 4: Dubai Annual Property Price Growth (YoY %) — Apartments vs Villas 2020–2025 | Source: Knight Frank, REIDIN
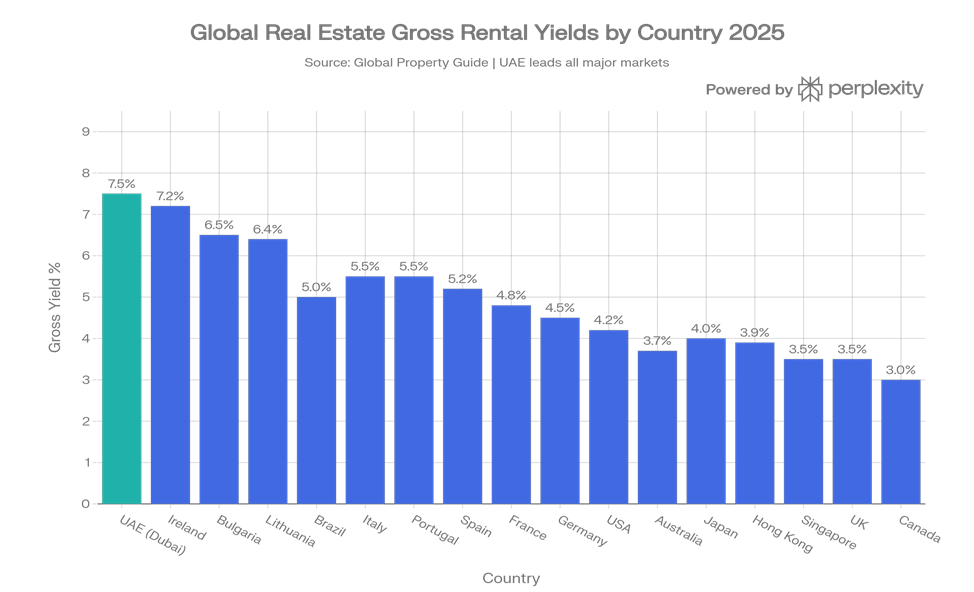
Figure 5: Dubai Quarterly Average Price per Sq Ft (AED) Q1 2020–Q1 2026 | Source: Knight Frank, REIDIN
03 DUBAI 2040 URBAN MASTER PLAN — COMPLETE ANALYSIS
3.1 Background and Strategic Vision
The Dubai 2040 Urban Master Plan, launched in March 2021, is the seventh consecutive urban development plan in a series stretching back to 1960. Between 1960 and 2020, Dubai’s population multiplied 80 times — from 40,000 to 3.3 million — while its built area expanded 170-fold. The plan projects the residential population to reach 5.8–7.8 million by 2040 and commits a fundamental paradigm shift: concentrate urban investment in five designated centres, protect 60% of Dubai’s land as nature reserves, and build a city designed around human wellbeing, sustainable mobility, and integrated services.
The plan’s most consequential commitment for real estate investors is its designated five urban centres — each receiving targeted government infrastructure spending over 20+ years. Properties within these centres will benefit from the compounding effect of government-funded infrastructure, connectivity improvements, and population densification, all of which are historically the most reliable drivers of real estate appreciation.
The plan aligns with the USD 650 billion Dubai Economic Agenda D33 (targeting GDP doubling by 2033) and supports an ecosystem designed to attract 9,800+ new millionaires per year. In aggregate, the 2040 plan creates a government-backed demand floor for real estate that no other major global market can replicate with equivalent certainty.
3.2 Key 2040 Metrics and Direct Real Estate Significance
| Metric | Target by 2040 | Direct Real Estate Implication |
| Population | 5.8–7.8 million (from ~4M today) | ~240,000+ new housing units of structural demand needed |
| Public Beaches | +400% increase in length | Waterfront premium expands across more community locations |
| Green/Recreational Areas | Double existing coverage | Liveability premiums in community real estate assets |
| Hotel/Tourism Land | +134% increase | Hospitality assets in all five zones benefit long-term |
| Commercial Land | Expand to 168 sq km | Office/commercial real estate demand support through 2040 |
| Education/Health Land | +25% expansion | Community RE near new schools/hospitals appreciates |
| National Housing Programme | AED 65 billion committed | Mid-market price floor reinforced by government support |
| Infrastructure Investment | AED 650B by 2033 (D33) | Connectivity unlocks previously undervalued areas |
| Tourism Target | +600% in annual visitors | Sustained short-term rental and hospitality demand platform |
| New Urban Centres | Two brand-new centres created | First-mover land pricing advantage in Expo City/DSO corridors |
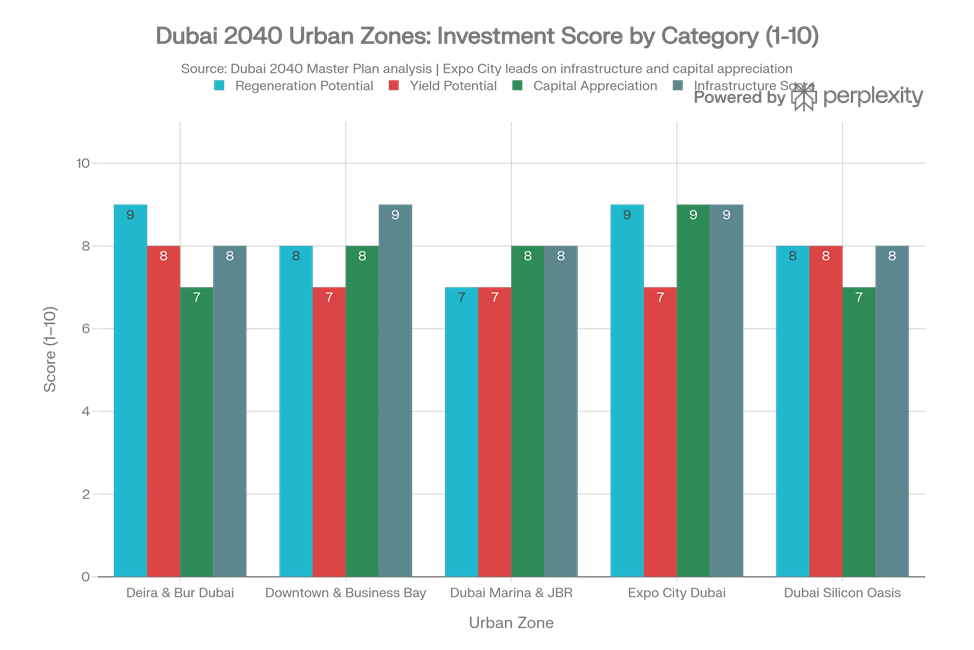
Figure 6: Dubai 2040 Urban Zones Investment Scores by Category | Source: Analysis based on Dubai 2040 Master Plan
3.3 The Five Urban Centres — Zone-by-Zone Investment Analysis
Zone 1: Deira & Bur Dubai — Heritage Reimagined
| 2040 Plan Role: Dubai’s historic trading heart — Gold Souk, Spice Souk, dhow wharfage. Designated as a cultural preservation corridor with major urban regeneration investment. Hotel/tourism land increases 134%. Metro Blue Line extension enhances connectivity. Government-funded streetscape and waterfront activation projects totalling billions of dirhams. | Investor Implication: Highest-potential regeneration play in Dubai. Properties currently trade at significant discounts to established communities — a price-convergence opportunity. 5–10 year investors should consider mixed-use assets before government-led appreciation captures the upside. The cultural revival drives hotel and serviced apartment demand. |
Zone 2: Downtown Dubai, Business Bay & DIFC — The Financial Core
| 2040 Plan Role: Dubai’s historic trading 2040 Plan Role: Most mature premium market. Reinforced as the primary financial and commercial centre with continued densification. Adjacent Dubai Creek Harbour (6 km²) adds waterfront prestige. D33 agenda calls for 12 million sq ft of new Grade A office space with this zone as anchor. DIFC occupancy at 98% as of 2026. | Investor Implication: Most liquid market in Dubai. Business Bay gross yields of 6.8–7% at AED 1,500–2,000/sqft. The zone’s reinforcement as the financial core means long-term institutional demand support. Off-plan at launch pricing offers the best entry vs resale at current values. Select Group’s Peninsula development (AED 7B GDV, fully sold out) illustrates the depth of investor demand. |
Zone 3: Dubai Marina & JBR — International Tourism Hub
| 2040 Plan Role: Premier tourism, leisure, and international lifestyle hub. +400% increase in public beach length, +134% hotel/tourism land, 600% increase in tourism visitors targeted. Ciel Tower — world’s tallest hotel — under construction. Pedestrian and cycling connectivity to Bluewaters Island being enhanced. | Investor Implication: 7,572 transactions in 2025 alone — highest liquidity by volume. Gross yields of 6.5–7% long-term or 10–15% via professionally managed short-term rental. Best for either a 5–7 apartment income portfolio or a single premium branded residence (AED 8–15M) with lifestyle flexibility. |
Zone 4: Expo City Dubai — Sustainability & Innovation District
| 2040 Plan Role: One of two brand-new urban centres created by the plan. Adjacent to Al Maktoum International Airport (AMIA) — undergoing USD 35B expansion to 260M passengers annually. Designated as exhibitions, MICE, sustainable living, and innovation hub. Commercial land in this zone expanding to 168 sq km. Dubai South master community recorded 10,034 transactions in 2025. | Investor Implication: Highest-upside, longest-runway opportunity. Entry prices AED 800–1,500/sqft versus AED 1,800–2,800/sqft in established zones. The AMIA mega-airport expansion transforms this from speculative to a fundamentals-backed infrastructure appreciation trade. Off-plan projects (Emaar South, Urbana, Greenview) forecast 40–50% appreciation to handover. |
Zone 5: Dubai Silicon Oasis — Knowledge & Technology Corridor
| 2040 Plan Role: Primary knowledge, technology, and innovation district. Designated hub for AI, blockchain, biotech, and digital industries. Plans include expansion of the DSO free zone, new tech campuses, R&D facilities, metro connectivity (Red Line extension), and integrated smart communities built from inception with digital infrastructure. | Investor Implication: Consistently delivers Dubai’s highest rental yields — 8.2% — at accessible entry pricing (AED 700–1,200/sqft). As D33 drives technology company formation and relocation, DSO’s residential demand base deepens structurally. The 2040 plan’s designation as a formal urban centre signals government infrastructure investment not yet priced in. Best risk-adjusted yield among all five zones. |
04 GLOBAL ROI & YIELD COMPARISONS
4.1 Why Dubai Leads Global Yield Rankings
Dubai’s rental yields are not merely competitive — they exist in a different category from most major markets. Average gross yields range from 6.7–6.9% across the market, with high-demand communities delivering 8.5–9.3%. These compare to London 3.5%, New York 4.2%, Singapore 3.5%, and Hong Kong 3.9%. Five structural reasons explain this durable advantage:
- Zero income tax on rental income 100% of gross yield is net — unlike UK (20–45%), US (37%), Germany (45%), Australia (45%)
- Zero capital gains tax No tax on property appreciation regardless of holding period or profit amount
- Zero annual property tax Unlike US 1–2%/year, UK council tax, Singapore ABSD on purchase, or French taxe foncière
- Structurally captive tenant market 90%+ of Dubai’s population is expatriate; nearly all rent, creating persistent structural demand
- Affordable entry price relative to income At USD 458/sqft average, Dubai is 50–80% below comparable global cities, allowing higher yield ratios
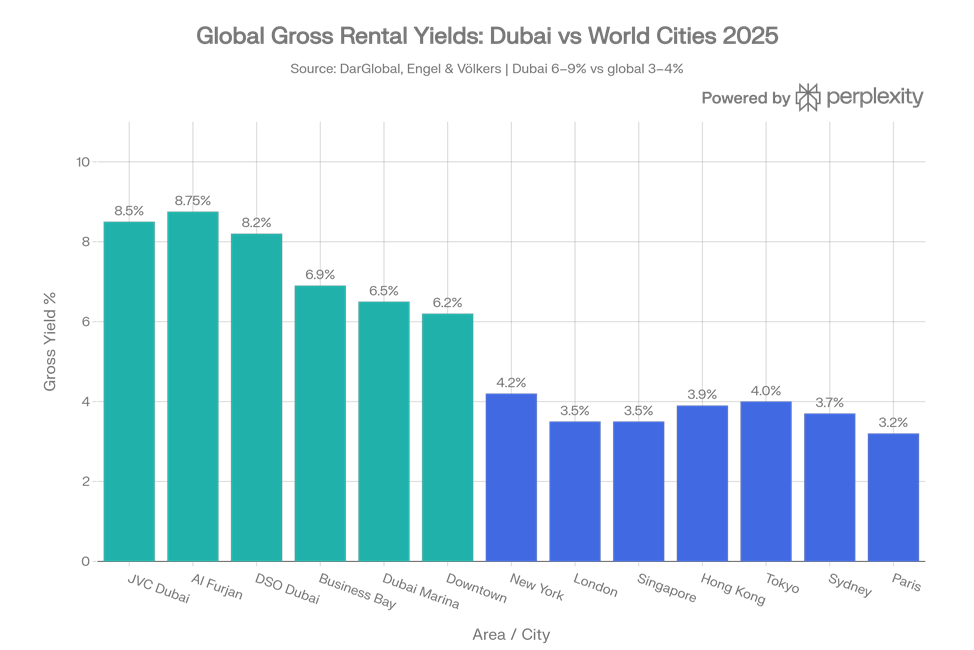
Figure 7: Global Gross Rental Yields — Dubai Areas vs Major World Cities 2025 | Source: DarGlobal, Engel & Völkers
Figure 8: Gross Rental Yields by Country — UAE Leads All Major Investment Markets 2025 | Source: Global Property Guide, RWInvest
Figure 9: Global Real Estate Total Return (Rental Yield + Capital Growth) by Country | Source: Global Property Guide, Knight Frank
4.2 Comprehensive Global Yield & ROI Table (20 Markets)
| Country/City | Gross Yield | 5yr Cap. Growth | CGT | Tax on Rental | Foreign Ownership |
| UAE (Dubai) | 6.7–9.3% | +99–206% | None | None | Full freehold |
| Ireland | 7.2% | +35% | 33% | 20–40% | Open |
| Bulgaria | 6.5% | +30% | 10% | 10% | Open (EU) |
| Lithuania | 6.4% | +40% | 15% | 15% | Open (EU) |
| Brazil | 5.0% | +20% | 15–22.5% | 27.5% | Open |
| Italy | 5.5% | +15% | 26% | 21% flat | Open (EU) |
| Portugal | 5.5% | +45% | 28% | 28% | Open (EU) |
| Spain | 5.2% | +40% | 19–23% | 19–24% | Open (EU) |
| France | 4.8% | +10% | 30% | 30% | Open (EU) |
| Germany | 4.5% | +15% | 25% (<10yr) | 45% | Open (EU) |
| Japan (Tokyo) | 4.0% | +10% | 20% | 20% | Open |
| Hong Kong | 3.9% | –15% | None | Stamp duty 30%+ | Open but costly |
| USA (New York) | 4.2% | +12% | 15–23.8% | 37% fed | Open |
| Australia | 3.7% | +40% | 50% discounted CGT | 45% | FIRB required |
| Singapore | 3.5% | +20% | None | 17% corp | ABSD 60%+ for foreigners |
| UK (London) | 3.5% | +15% | 18–28% | 20–45% | Open |
| Mexico | 4.8% | +15% | 25% | 35% | Restricted coastal |
| New Zealand | 3.4% | +25% | None | 33% | Restricted |
| South Korea | 3.2% | +10% | 6–45% | 6–45% | Open (approval) |
| Canada | 3.0% | +25% | 50% of gains | 40%+ | Restricted (foreign buyer bans) |
4.3 Tax-Adjusted Net Yield: The Real Comparison
For a USD 10 million investor generating gross rental income, the tax-adjusted comparison reveals Dubai’s true structural advantage. The following assumes a USD 10M portfolio at each country’s average yield:
| Jurisdiction | Gross Yield | Gross Rental Income | Tax Rate on Rental | Net Rental Income | Net Yield |
| Dubai (UAE) | 7.0% | USD 700,000 | 0% | USD 700,000 | 7.0% |
| France | 4.8% | USD 480,000 | 30% | USD 336,000 | 3.4% |
| USA (New York) | 4.2% | USD 420,000 | ~35% | USD 273,000 | 2.7% |
| Germany | 4.5% | USD 450,000 | 45% | USD 247,500 | 2.5% |
| Singapore | 3.5% | USD 350,000 | 17% corp | USD 290,500 | 2.9% |
| UK (London) | 3.5% | USD 350,000 | 40% | USD 210,000 | 2.1% |
| Australia | 3.7% | USD 370,000 | 45% | USD 203,500 | 2.0% |
Figure 10: Property Price per Sq Ft (USD) — Dubai vs Global Cities 2025 | Source: Knight Frank, fäm Properties
05 INVESTMENT FRAMEWORK FOR FOREIGN INVESTORS
5.1 Legal Framework — Freehold Ownership Rights
Under UAE Law No. 7 of 2006 and subsequent amendments, non-UAE nationals may acquire full freehold ownership — perpetual ownership of both land and building — in Dubai’s designated investment areas, without any time restriction. The title deed is issued by the Dubai Land Department and explicitly designates the foreign buyer as “landowner” — legally equivalent to the rights of UAE nationals within freehold zones. Over 60 designated freehold zones encompass all major investment areas.
- Right to sell to any buyer (local or foreign) at any time with no minimum holding period
- Right to lease the property without government approval or restriction
- Right to mortgage the property with UAE or international financial institutions
- Right to pass the property through inheritance without special permits
- No residency, citizenship, or minimum holding period required to purchase or retain ownership
- No restrictions on repatriation of sale proceeds or rental income
5.2 The Golden Visa — Residency Through Property
The Golden Visa programme grants 10-year renewable residency to foreign nationals owning UAE property with a combined market value of AED 2 million (USD 545,000). It is the most accessible premium residency-by-investment programme in the world, and it requires no active business or minimum income — just the property itself.
| Feature | Detail |
| Minimum Threshold | AED 2 million in completed, registered property (multiple units can be combined) |
| Mortgaged Properties | Qualify — bank NOC suffices; mortgage does not disqualify from Golden Visa |
| Dependents | Spouse, children, and domestic staff can be sponsored under the same visa |
| Tenure | 10-year renewable; no annual renewal, no tax filing, no minimum residency days |
| Business Rights | Can own/operate UAE businesses without requiring a UAE national sponsor |
| Comparison — UK | Tier 1 Investor Visa abolished entirely in February 2022 |
| Comparison — USA | EB-5 Investor Visa requires USD 800K–1.05M + multi-year USCIS processing |
| Comparison — Singapore | Global Investor Programme requires SGD 10 million investment minimum |
| Comparison — Australia | Significant Investor Visa requires AUD 5 million in approved assets |
5.3 Full Acquisition Cost Budget
| Cost Item | Rate | Notes |
| DLD Transfer Fee | 4% of purchase price | Paid by buyer by convention; law allows split with seller |
| DLD Trustee / Registration | AED 4,200 incl. VAT | For all properties ≥ AED 500,000 |
| Title Deed Issuance | AED 580 | Per deed; issued and held by DLD |
| Real Estate Agent Commission | 2% + 5% VAT = 2.1% effective | Market convention; negotiable on USD 5M+ values |
| Developer NOC Fee | AED 500–5,000 | Varies by developer and project |
| Off-Plan Oqood Registration | 4% of purchase price | Same rate as transfer fee; paid at time of off-plan contract |
| TOTAL ACQUISITION COST | ~6.5–8% of purchase price | All-in buyer estimate including all government fees |
| Annual Service Charge | AED 8–35 per sqft/year | Paid to Owners Association (ongoing; not a tax) |
| Annual Property Tax | ZERO | No property tax anywhere in the UAE |
| Capital Gains Tax on Exit | ZERO | No capital gains tax regardless of profit or holding period |
5.4 Mortgage Financing for Foreign Buyers (2026 Rates)
| Buyer Type | Max LTV | Rate (2026) | Max Term | Notes |
| UAE Resident Expat (property < AED 5M) | 80% | 3.5–6.65% p.a. | 25 years | UAE residence visa required |
| UAE Resident Expat (property > AED 5M) | 70% | 3.5–6.65% p.a. | 25 years | Higher value threshold applies |
| Non-Resident Foreign Buyer | 50–65% | 4.5–7.0% p.a. | 20 years | Varies by bank; proof of income required |
| Off-Plan Properties | 50% | Variable | 25 years | Developer payment plan often more attractive |
06 DEVELOPER ANALYSIS — KEY MARKET PLAYERS
Figure 11: Dubai Developer Market Share 2024–2025 | Source: DLD, Knight Frank
6.1 Emaar Properties — Market Leader
★★★★★ TIER 1 — BLUE-CHIP BENCHMARK
Emaar is Dubai’s largest and most globally recognised developer, responsible for Downtown Dubai (Burj Khalifa, Dubai Mall, Dubai Opera), Dubai Marina, Dubai Hills Estate, Arabian Ranches, and Emaar Beachfront — dozens of master-planned communities covering hundreds of millions of sq ft.
| Metric | FY 2025 |
| Group Revenue | AED 49.6 billion (+40% YoY) |
| Group Net Profit Before Tax | AED 25.7 billion (+36%) |
| Emaar Development Property Sales | AED 71.1 billion (+9% vs 2024 record) |
| Emaar Development Revenue | AED 27.5 billion (+44%) |
| Emaar Development Net Margin | 56% — net profit AED 15.5 billion (+52%) |
| Revenue Backlog | AED 125.2 billion (+38%) — multi-year earnings visibility |
Key Projects: Emaar South, The Oasis, Emaar Beachfront, Dubai Creek Harbour, Address Residences, Arabian Ranches 3, Dubai Hills Estate
Investor Verdict
Lowest-risk developer for off-plan investment. DFM-listed transparency, unmatched delivery track record, and brand premium that sees Emaar properties trade at 10–20% above non-branded comparable product in secondary markets. Best combination of capital appreciation, liquidity, and quality for the USD 10M investor.
6.2 Sobha Realty — Vertically Integrated Quality
★★★★★ TIER 1 — QUALITY LEADER
Founded by Indian billionaire PNC Menon. Distinguished by its “Backward Integration” model — controlling every stage from design through construction to delivery. This ensures build quality consistently among the highest in Dubai. Holds a USD 4 billion land bank and has delivered 130+ million sq ft globally.
| Metric | Data |
| Total Delivered (Global) | 130+ million sq ft across UAE and India |
| Dubai Land Bank | USD 4 billion |
| Hartland II Size | 8 million sq ft, 90 acres of green space, 5–6 bed villas |
| Hartland II Status in 2025 | Top-10 highest-selling project in Dubai for full year 2025 |
Key Projects: Sobha Hartland (MBR City), Sobha Hartland II, Sobha One
Investor Verdict
Above-market build quality with consistent delivery. Properties hold resale value well. Best for investors prioritising construction quality and premium community living at a moderate discount to Palm Jumeirah or Downtown Dubai pricing.
6.3 Select Group — Premium Waterfront Specialist
★★★★☆ TIER 1 — ULTRA-PREMIUM
Dubai’s leading premium waterfront developer. Over 20 million sq ft of award-winning development with combined GDV exceeding AED 20 billion. Known for Marina Gate in Dubai Marina and the landmark Peninsula community in Business Bay — AED 7 billion GDV, 3,300 units, fully sold out.
| Metric | Data |
| Peninsula GDV | AED 7 billion — 3,300 units across 7 developments |
| Peninsula Status | Fully sold out; handovers commenced 2025–mid 2026 |
| Jumeirah Living Tower | 82 residences, 2,007–12,000 sq ft, ultra-luxury Business Bay |
| Six Senses Partnerships | Branded residences in Dubai Marina and The Palm — 30–50% brand premium |
Key Projects: Marina Gate I, II, III; Peninsula Business Bay; Six Senses Residences Dubai Marina; Six Senses Residences The Palm
Investor Verdict
Targets the ultra-premium 1% of the market. Capital appreciation in Select Group projects is among the strongest in Dubai. Best for investors seeking trophy assets or branded residence exposure where 30–50% brand premiums are justified by the buyer pool.
6.4 SOL Properties — Heritage Builder, Modern Luxury
★★★★☆ TIER 1 — 50-YEAR TRACK RECORD
Real estate development arm of the Bhatia Group (BGCC), established in 1975 — one of the UAE’s oldest and most respected construction groups. Over 250 completed projects with 10,000+ skilled professionals. Operates across Business Bay, Palm Jumeirah, Downtown, JVC, and JVT.
| Metric | Data |
| Group Founded | 1975 — one of UAE’s oldest construction and development groups |
| Projects Delivered | 250+ successful completions across UAE |
| Workforce | 10,000+ skilled professionals across disciplines |
| Development Focus | Luxury residential, commercial, hospitality in prime Dubai locations |
Key Projects: Multiple developments across Business Bay, Palm Jumeirah, Downtown Dubai, JVC, JVT
Investor Verdict
The 50+ year construction heritage provides delivery credibility that newer developers cannot match. In-house construction capability through BGCC gives the same quality control advantage as Sobha. Best for investors seeking premium boutique projects with institutional-quality delivery in established prime locations.
6.5 Beyond Developments (by Omniyat) — Design-Led Coastal Luxury
★★★★☆ TIER 1 — GROWTH-PLAY OFF-PLAN
Launched 2024 under Omniyat — one of Dubai’s most prestigious luxury developers (One at Palm Jumeirah, AVA at Palm Jumeirah). Beyond focuses on coastal, design-led developments at Dubai Maritime City, Palm Jumeirah, and adjacent corridors. Passo on Palm Jumeirah East Crescent launched August 2025 with completion targeted 2029.
| Project | Details |
| Sensia by Beyond | Dubai Maritime City — 35-story, 1–3BR apartments |
| Orise by Beyond | Dubai Maritime City — 1–4BR + duplexes/penthouses |
| Passo by Beyond | Palm Jumeirah East Crescent — launched Aug 2025, completion 2029 |
| Soulever by Beyond | Dubai Maritime City — 38-story, panoramic sea views |
Key Projects: Sensia, Orise, Passo (Palm Jumeirah East Crescent), Soulever
Investor Verdict
Best for off-plan investors with 3–5 year horizon seeking design-driven coastal product at pre-maturity pricing. Dubai Maritime City’s development trajectory and Omniyat’s brand premium position early investors for significant capital appreciation as the area matures from emerging to established.
6.6 Dubai Properties — Government-Backed Community Builder
★★★★☆ TIER 1 — GOVERNMENT CREDIBILITY
Subsidiary of Dubai Holding — one of Dubai’s largest government-linked conglomerates. Flagship Villanova master community in Dubailand is consistently ranked among the top 3 most popular areas for villa/townhouse purchases in Dubai. Gross rental yields of approximately 5.5%; family community focus with large green spaces.
| Metric | Data |
| Parent | Dubai Holding (government-linked conglomerate) |
| Flagship Development | Villanova — La Rosa, La Quinta, La Violeta, Amaranta, La Tilia phases |
| Villanova Rental Yield | ~5.5% gross; consistent tenant demand from families |
| Market Position | Consistently Top 3 most popular for villa/townhouse purchases in Dubai |
Key Projects: Villanova (Dubailand — multiple phases); other mixed-use communities across the emirate
Investor Verdict
Government backing provides an implicit delivery guarantee no private developer can replicate. Villanova’s family positioning, large green spaces, and competitive pricing relative to Dubai Hills Estate make it ideal for long-term rental income investors targeting the family tenant segment with stable, predictable yields.
6.7 Developer Comparison Matrix
| Developer | Market Position | Price Range (AED) | Avg Yield | Delivery Record | Best Investment Fit |
| Emaar | Market leader | 800K – 30M+ | 5.5–7.0% | Excellent | Capital growth + liquidity |
| Sobha Realty | Premium quality | 1.5M – 20M | 5.5–7.5% | Very Good | Quality + appreciation |
| Select Group | Ultra-premium | 3M – 80M+ | 4.5–6.0% | Very Good | Trophy / branded assets |
| SOL Properties | Luxury boutique | 1.5M – 30M | 5.0–7.0% | Good | Craftsmanship + prime locations |
| Beyond (Omniyat) | Design luxury coastal | 2M – 50M | 4.5–6.5% | Good (heritage) | Off-plan capital growth |
| Dubai Properties | Community builder | 700K – 5M | 5.0–6.5% | Good | Stable rental yield income |
| DAMAC | Volume + luxury | 500K – 25M | 6.0–8.0% | Variable | Yield-focused portfolio |
| Nakheel | Iconic waterfront | 2M – 200M+ | 4.0–6.0% | Very Good | Prestige + long-term value |
07 INVESTMENT STRATEGY FOR USD 10 MILLION
7.1 Dubai Area Rental Yields 2025
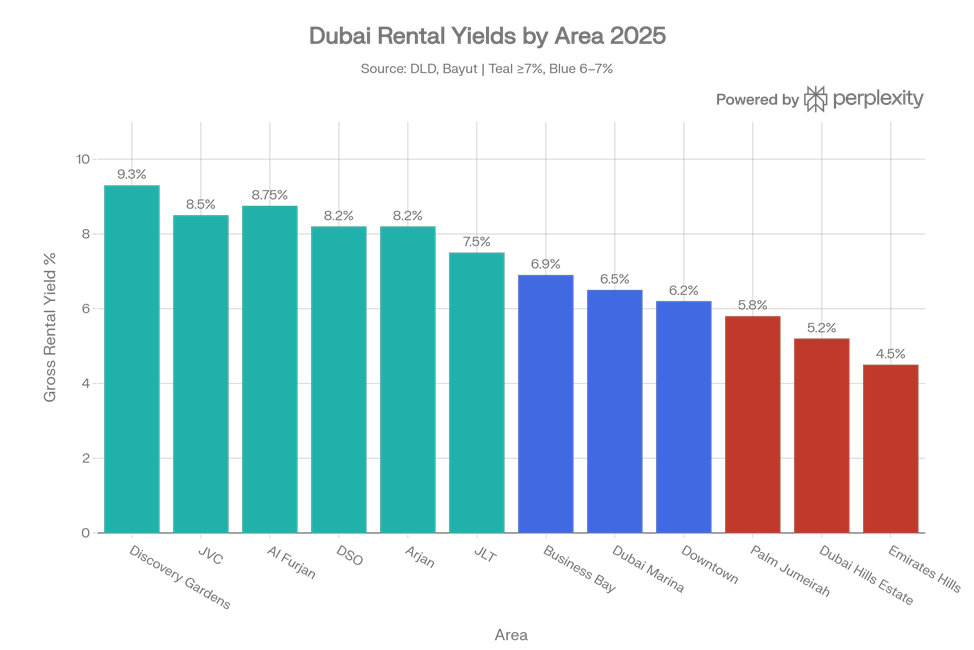
Figure 12: Dubai Gross Rental Yields by Area 2025 | Source: DLD, Bayut, DarGlobal
| Area | Avg. Gross Yield | Typical Entry (AED) | Best Unit Type | Investment Profile |
| Discovery Gardens | 9.3% | AED 400K–700K | Studio, 1BR | Maximum yield; mass market |
| JVC | 8.5% | AED 500K–1.5M | Studio, 1BR, 2BR | High yield + family community |
| Al Furjan | 8.75% | AED 600K–1.2M | 1BR, 2BR | High yield; metro proximity |
| Arjan | 8.2% | AED 500K–1M | Studio, 1BR | High yield; new supply |
| DSO | 8.2% | AED 500K–1.2M | 1BR, 2BR | High yield + tech tenant base |
| JLT | 7.5% | AED 800K–2M | 1BR, 2BR | Strong yield + DMCC anchor |
| Business Bay | 6.9% | AED 1.2M–3.5M | 1BR, 2BR | Balanced yield + capital upside |
| Dubai Marina | 6.5% | AED 1.2M–6M | 1BR–3BR | STR potential 10–15% |
| Downtown Dubai | 6.2% | AED 1.5M–15M+ | 1BR, 2BR, Penthouse | Trophy + liquidity |
| Palm Jumeirah | 5.8% | AED 2.5M–50M+ | Apartments, Villas | Prestige + STR 8–12% |
| Dubai Hills Estate | 5.2% | AED 2M–25M | Apartments, Villas | Family community, growth |
| Emirates Hills | 4.5% | AED 10M–80M+ | Ultra-luxury Villas | Ultra-HNWI trophy |
Figure 13: Dubai Off-Plan vs Ready/Secondary Market Share 2021–2025 | Source: DLD, DXB Interact
7.2 Portfolio Allocation Frameworks for USD 10 Million
Three portfolio blueprints for a USD 10 million (approx. AED 36.7 million) investor, based on differing investment objectives:
Strategy A — Maximum Yield Portfolio (Target: 7.5–9.0% gross yield)
Focus on high-yield mid-market assets. All assets immediately income-generating via long-term or managed short-term lease. Blended gross yield ~7.8–8.5% — all net of tax in Dubai.
| Allocation | Asset Type | Location | Est. AED Value | Est. Gross Yield |
| 30% | 3 x Studio/1BR apartments | JVC, Al Furjan, DSO | ~AED 1.1M each | 8.5–9.3% |
| 30% | 2 x 2BR apartments | Business Bay, JLT | ~AED 1.8M each | 7.0–7.5% |
| 25% | 1 x 3BR apartment | Dubai Marina | ~AED 3.2M | 6.5–7.0% |
| 15% | 1 x Off-plan unit | Expo City / Dubai South | ~AED 1.5M | 6–7% at handover |
Strategy B — Balanced Growth + Income (Target: 6–7% yield + 10–15% annual appreciation)
Mix of ready income-generating assets and off-plan for capital appreciation. Primary focus on established communities with strong resale liquidity.
| Allocation | Asset Type | Location | Est. AED Value | Est. Total Return |
| 40% | 1 x Premium 3BR apartment (ready) | Downtown / Business Bay | AED 5.5–7M | 6.5–7% yield + 8–12% appreciation p.a. |
| 35% | 1 x Off-plan villa/townhouse | Dubai Hills / Emaar South | AED 4–5M | 30–50% appreciation to handover |
| 25% | 2 x 1BR apartments (yield focus) | Dubai Marina / JLT | ~AED 2M each | ~7.0% yield |
Strategy C — Ultra-Luxury Capital Preservation (Target: 4–6% yield + brand premium + lifestyle)
Single large-ticket trophy asset in a limited-supply location. For investors where capital preservation, lifestyle use, and Golden Visa qualify over maximum yield optimisation.
| Allocation | Asset Type | Location | Est. Value | Features |
| 100% | Ultra-luxury penthouse or signature villa | Palm Jumeirah / Downtown / Emirates Hills | AED 30–40M | 4–5.5% gross yield; 0% CGT; Golden Visa qualifying; lifestyle use; branded residence |
7.3 Short-Term vs Long-Term Rental Comparison
| Area | Long-Term Yield | Short-Term Yield (Airbnb/STR) | Mgmt Cost | Best Strategy |
| Dubai Marina | 6.5% | 10–15% | 15–20% of gross | Short-term with professional mgmt |
| JBR | 6.5% | 10–14% | 15–20% of gross | Short-term — high tourist demand year-round |
| Downtown Dubai | 6.2% | 9–13% | 15–20% of gross | Both viable; corporate STR strong |
| Palm Jumeirah | 5.8% | 8–12% | 15–20% of gross | Premium STR; leisure demand |
| JVC / DSO / Al Furjan | 8.5% | 8–9% | 15–20% of gross | Long-term superior; stable tenant demand |
| Business Bay | 6.9% | 8–11% | 15–20% of gross | Both viable; optimise by occupancy data |
08 DUBAI ECONOMIC FUNDAMENTALS
8.1 GDP, Population, and the D33 Agenda
Dubai’s economy grew 4.5% in 2025 and is projected to maintain the same pace in 2026 — significantly outperforming major Western economies. The Dubai Economic Agenda D33 targets doubling Dubai’s GDP from AED 507 billion to AED 8.5 trillion by 2033 through 100 transformative projects. At its core, D33 is an infrastructure and economic diversification programme that creates direct, quantifiable real estate demand:
| D33 Agenda Target | Detail | Real Estate Impact |
| GDP Growth | Double from AED 507B to AED 8.5 trillion by 2033 | Overall demand multiplier for all RE segments |
| New Grade A Office Space | 12 million sq ft — DIFC, Downtown, DSO anchors | Commercial RE demand; residential near offices |
| New Residential Units | 800,000 units to be delivered by 2033 | Government-tracked demand vs supply balance |
| New Hotel Rooms | 45,000 additional rooms by 2033 | Hospitality RE + serviced apartment demand |
| Infrastructure | AED 650 billion through 2033 | Connectivity unlocks new investment corridors |
| Foreign Trade Target | Increase to AED 25.6 trillion by 2033 | Trade hub status attracts corporate tenant base |
| Tourism Growth | 600% increase in visitors to 2040 | Sustained STR and hospitality real estate demand |
8.2 HNWI Inflows — The Primary Demand Driver
The UAE attracted 9,800 net new millionaires in 2025 — the highest net inflow globally. Dubai now houses 81,200 millionaires, a 12% year-on-year increase. Primary source countries: UK, Europe (driving post-Brexit, post-pandemic relocation), India, China, and Russia — all drawn by Dubai’s tax-free structure, Golden Visa certainty, world-class lifestyle, and geopolitical stability of the UAE. In Q1 2025, Dubai recorded 111 transactions above $10M with an average deal size of $17.1M. Ultra-prime supply (above $10M) fell 65% in 2024, meaning price pressure in the luxury segment is intense and structural.
8.3 Tourism and Airport Infrastructure
With 14 million visitors in the first 9 months of 2025 (+9% YoY), Dubai’s tourism engine continues operating at capacity. The UAE is the world’s 4th most visited country. The planned Al Maktoum International Airport (AMIA) expansion — targeting 260 million passengers annually at a cost of USD 35 billion — will dwarf Heathrow and Changi combined, creating a permanent aviation infrastructure advantage that anchors Dubai South and the Expo City corridor as long-term investment destinations.
8.4 Population Growth — Structural Housing Demand
Dubai’s population grew from 3.3 million in 2020 to 4.0 million in 2025 — a 21% increase in five years, making it the fastest-growing major global city. The 2040 plan targets 5.8–7.8 million residents by 2040, implying 240,000–480,000 additional housing units of structural demand beyond current supply pipelines. 90%+ of Dubai’s population is expatriate and rents rather than owns, creating a permanently elevated rental demand base. Every new company, every new millionaire, and every new institution that moves to Dubai requires housing — from studio apartments in JVC to villas in Emirates Hills.
09 RISK ASSESSMENT & MITIGATION
Every investment carries risk. For a USD 10 million investor in Dubai, the key risks can be identified, quantified, and largely mitigated through disciplined asset selection. The following analysis provides an honest assessment:
Supply Pipeline Risk
| Risk Level: MODERATE | Description Approximately 131,234 units in 2026 pipeline; 81% apartments. If handovers accelerate beyond forecast absorption, secondary apartment markets in oversupplied micro-areas could face 5–15% price pressure. | Mitigation Focus on villa, townhouse, and prime apartment segments. Diversify across 2–3 developers. Historical data shows actual handovers lag announcements by 30–50%. Monitor DLD quarterly handover data; avoid micro-areas with single developer 10,000+ unit simultaneous delivery. |
Geopolitical Risk
| Risk Level: LOW–MODERATE | Description Regional tensions periodically create sentiment-driven transaction volume weakness. Dubai has historically attracted capital during regional instability rather than losing it. Every prior geopolitical episode has been followed by stronger market performance. | Mitigation A 3–5+ year investment horizon eliminates short-term volatility exposure. Dubai’s political neutrality and status as a safe haven within the MENA region means it typically benefits from — not suffers from — regional instability. The UAE government’s resilience has been demonstrated repeatedly. |
Developer Risk (Off-Plan)
| Risk Level: LOW (Tier 1) / MODERATE (others) | Description Off-plan investment carries developer insolvency or delivery delay risk. Dubai’s RERA escrow account requirements ringfence buyer funds per project. Tier 1 developers (Emaar DFM-listed, Sobha, Select Group, Nakheel) carry significantly lower risk than newer, smaller developers. | Mitigation For off-plan above AED 5M per transaction, restrict to DFM-listed or financially transparent, long-track-record developers. Review RERA escrow account registration with DLD before contract signing. Request project completion guarantee or insurance where available. Check developer completion history. |
Currency Risk
| Risk Level: NONE (for USD Investors) | Description The UAE Dirham maintains a hard peg of AED 3.67 = USD 1.00 — unchanged since 1997. This peg is backed by the UAE’s sovereign wealth reserves and oil revenues, making it among the most stable currency pegs globally. | Mitigation For USD-based investors: zero currency risk. For EUR/GBP/AUD investors: your exposure is to USD/home-currency exchange rate movement, not to AED. Many non-USD investors choose Dubai specifically to hold assets in a USD-pegged currency, gaining implicit USD diversification. |
Regulatory Risk
| Risk Level: VERY LOW | Description Dubai’s government has consistently amended its regulatory framework in directions that favour investors: expanding freehold zones, new visa categories, reducing transaction friction, and improving DLD digital transparency and RERA tenant protections. | Mitigation The regulatory trajectory has been consistently positive for 20+ years. New laws around REIT structures, property tokenisation, and corporate real estate ownership are expanding rather than constraining the investor base. Introduction of property tax is politically unlikely given its centrality to Dubai’s competitive positioning globally. |
10 DUBAI VS GLOBAL REAL ESTATE — INVESTMENT SCORECARD
The following scorecard rates Dubai against five peer markets across 10 investor-critical dimensions, using a 5-star scale where ★★★★★ = best in class:
| Criterion | Dubai | London | New York | Singapore | Hong Kong | Sydney |
| Gross Rental Yield | ★★★★★ (7–9%) | ★★★ (3.5%) | ★★★ (4.2%) | ★★★ (3.5%) | ★★ (3.9%) | ★★ (3.7%) |
| Net After-Tax Yield | ★★★★★ (=Gross) | ★★ (2.1%) | ★★ (2.7%) | ★★★ (2.9%) | ★★★ (3%) | ★★ (2.0%) |
| 5yr Capital Growth | ★★★★★ (+99–206%) | ★★★ (+15%) | ★★★ (+12%) | ★★★ (+20%) | ★ (−15%) | ★★★★ (+40%) |
| Legal Security | ★★★★★ (Freehold) | ★★★★★ | ★★★★★ | ★★★ (ABSD) | ★★★★ | ★★★ (FIRB) |
| Entry Cost | ★★★★ (6.5–8%) | ★★ (10%+) | ★★★ (5–8%) | ★ (35–60%) | ★★ (15–30%) | ★★★ (5–7%) |
| Annual Holding Costs | ★★★★★ (Zero) | ★★★ (council tax) | ★★ (1–2%/yr) | ★★★★ (Low) | ★★★★ (Low) | ★★★ (land tax) |
| CGT on Exit | ★★★★★ (Zero) | ★★★ (18–28%) | ★★★ (15–24%) | ★★★★ (None) | ★★★★ (None) | ★★ (discount) |
| Residency Benefit | ★★★★★ (Golden Visa) | ★ (abolished) | ★★ (EB-5 complex) | ★★ (SGD 10M GIP) | ★★★ | ★★ |
| Market Liquidity | ★★★★★ (215k+ deals) | ★★★★★ | ★★★★ | ★★★ | ★★★ | ★★★ |
| Long-Term Growth Story | ★★★★★ (2040+D33) | ★★★ | ★★★ | ★★★★★ | ★★ | ★★★★ |
APPENDIX — KEY DATA REFERENCE TABLES
A1. Dubai Annual Transaction Summary 2020–2025
| Year | Transactions | Value (AED B) | Value (USD B) | YoY Txn Δ | YoY Value Δ |
| 2020 | 33,279 | AED 69.4B | USD 18.9B | — | — |
| 2021 | 59,507 | AED 148.6B | USD 40.5B | +78.8% | +114.1% |
| 2022 | 95,732 | AED 262.7B | USD 71.6B | +60.9% | +76.8% |
| 2023 | 132,260 | AED 408.7B | USD 111.4B | +38.1% | +55.6% |
| 2024 | 179,756 | AED 520.2B | USD 141.7B | +35.9% | +27.3% |
| 2025 | 215,060 | AED 682.6B | USD 186.0B | +19.6% | +31.2% |
A2. Global Real Estate Yield & ROI Reference (20 Markets)
| Region | Country/City | Gross Yield | 5yr Cap Growth | CGT | Tax on Rental | Entry Restrictions |
| Middle East | UAE (Dubai) | 6.7–9.3% | +99–206% | None | None | Open freehold |
| E. Europe | Lithuania | 6.4% | +40% | 15% | 15% | Open (EU) |
| E. Europe | Bulgaria | 6.5% | +30% | 10% | 10% | Open (EU) |
| S. Europe | Italy | 5.5% | +15% | 26% | 21% | Open (EU) |
| S. Europe | Portugal | 5.5% | +45% | 28% | 28% | Open (EU) |
| S. Europe | Spain | 5.2% | +40% | 19–23% | 19–24% | Open (EU) |
| W. Europe | France | 4.8% | +10% | 30% | 30% | Open (EU) |
| W. Europe | Germany | 4.5% | +15% | 25% (<10yr) | 45% | Open (EU) |
| W. Europe | UK (London) | 3.5% | +15% | 18–28% | 20–45% | Open |
| W. Europe | Ireland | 7.2% | +35% | 33% | 20–40% | Open |
| N. America | USA (New York) | 4.2% | +12% | 15–23.8% | 37% fed | Open |
| N. America | Canada | 3.0% | +25% | 50% of gains | 40%+ | Restricted |
| Asia-Pacific | Australia | 3.7% | +40% | CGT discounted | 45% | FIRB required |
| Asia-Pacific | Japan (Tokyo) | 4.0% | +10% | 20% | 20% | Open |
| Asia-Pacific | Singapore | 3.5% | +20% | None | 17% corp | ABSD 60%+ |
| Asia-Pacific | Hong Kong | 3.9% | –15% | None | Stamp 30%+ | Open but costly |
| Asia-Pacific | New Zealand | 3.4% | +25% | None | 33% | Restricted |
| Asia-Pacific | S. Korea | 3.2% | +10% | 6–45% | 6–45% | Open (approval) |
| L. America | Brazil | 5.0% | +20% | 15–22.5% | 27.5% | Open |
| L. America | Mexico | 4.8% | +15% | 25% | 35% | Restricted coastal |
DUBAI REAL ESTATE INVESTMENT REPORT 2026
Data Sources: Dubai Land Department · Knight Frank · REIDIN · DXB Analytics
Bayut · DarGlobal · Engel & Völkers · Global Property Guide · RWInvest · fäm Properties
Prepared: April 2026 · All values in USD or AED · AED/USD peg: 3.67
This document is for informational purposes only. Past performance does not guarantee future results.
Investors should seek independent legal and financial advice before committing capital.