

- April 22, 2026
- 3
- News&Media
The total real estate transactions in Dubai for Week 3 was AED 11.55 billion and 4,896 transactions. Off-Plan contributed 66.2% or 7.64 billion, while Ready properties contributed 33.8% or 3.91 billion.
Total trading in the third week of 2026 reached AED 11.55B across 4,896 transactions. Off-Plan dominated with AED 7.64B (66.2%), while Ready accounted for AED 3.91B (33.8%).
| Category | Off-Plan (AED millions) | Ready (AED millions) |
| Flat | 4,798.8 | 2,366.9 |
| Villa | 1,707.3 | 746.2 |
| Hotel Apt. & Rooms | 23.0 | 194.2 |
| Commercials | 1,112.0 | 598.7 |
| Total | 7,641.2 | 3,906.0 |
Off-Plan Market Performance
- Total Value: AED 7.64B
- Share of Weekly Total: 66.2%
| Sub-Category | Value (AED million) | % of Off-Plan |
| Flat | 4800 | 62.8% |
| Villa | 1.71 | 22.3% |
| Hotel Apt. & Rooms | 23.0 | 0.3% |
| Commercials | 1.11 | 14.6% |
Off-plan activity was led by flats (62.8%), with villas (22.3%) reinforcing depth in the family-home segment, while commercials (14.6%) remained a meaningful contributor, an indicator of sustained investor appetite beyond residential.
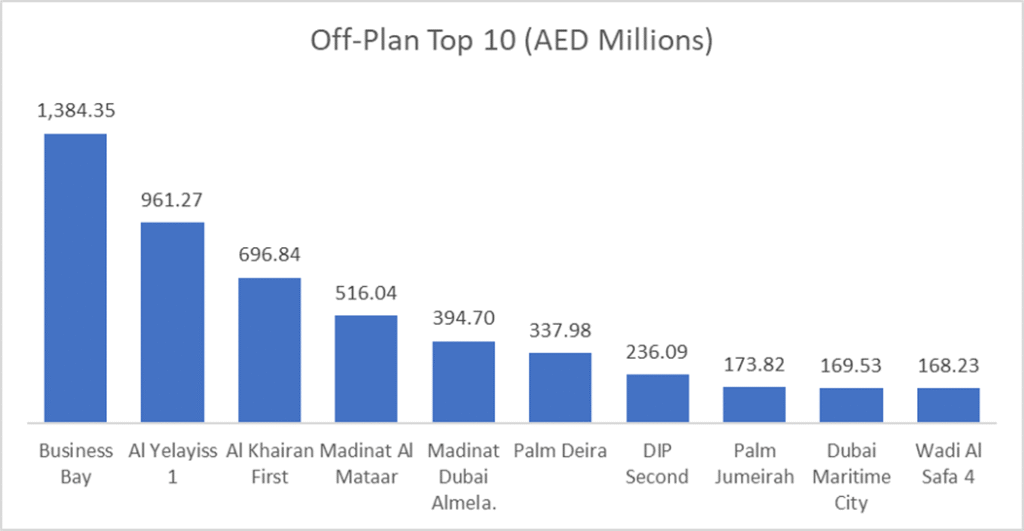
Top Performing Off-Plan Areas
| Area | Value (AED) | % of Off-Plan Total |
| Business Bay | 1.38B | 18.1% |
| Al Yelayiss 1 | 961.3M | 12.6% |
| Al Khairan First | 696.8M | 9.1% |
| Madinat Al Mataar | 516.0M | 6.8% |
| Madinat Dubai Almela. | 394.7M | 5.2% |
The off-plan market was highly concentrated, with the top 10 areas contributing ~65.9% of total off-plan value. Business Bay alone delivered 18.1%, reinforcing its position as the core weekly liquidity hub, while Al Yelayiss 1 and Al Khairan First together added another 21.7%, pointing to strong demand in emerging/expanding growth corridors.
Ready Market Performance
- Total Value: AED 3.91B
- Share of Weekly Total: 33.8%
| Sub-Category | Value (AED millions) | % of Ready |
| Flat | 2370 | 60.6% |
| Villa | 746.2 | 19.1% |
| Hotel Apt. & Rooms | 194.2 | 5.0% |
| Commercials | 598.7 | 15.3% |
Ready was also led by flats (60.6%), while villas (19.1%) and commercials (15.3%) held a solid share, consistent with off plan, suggesting balanced investor interest across both primary and secondary markets.
Top Performing Ready Areas
| Area | Value (AED Millions) | % of Ready Total |
| Burj Khalifa | 395.7 | 10.1% |
| Business Bay | 341.8 | 8.7% |
| Arjan | 293.1 | 7.5% |
| Jumeirah Village Circle | 232.5 | 5.9% |
| Dubai Marina | 195.5 | 5.0% |
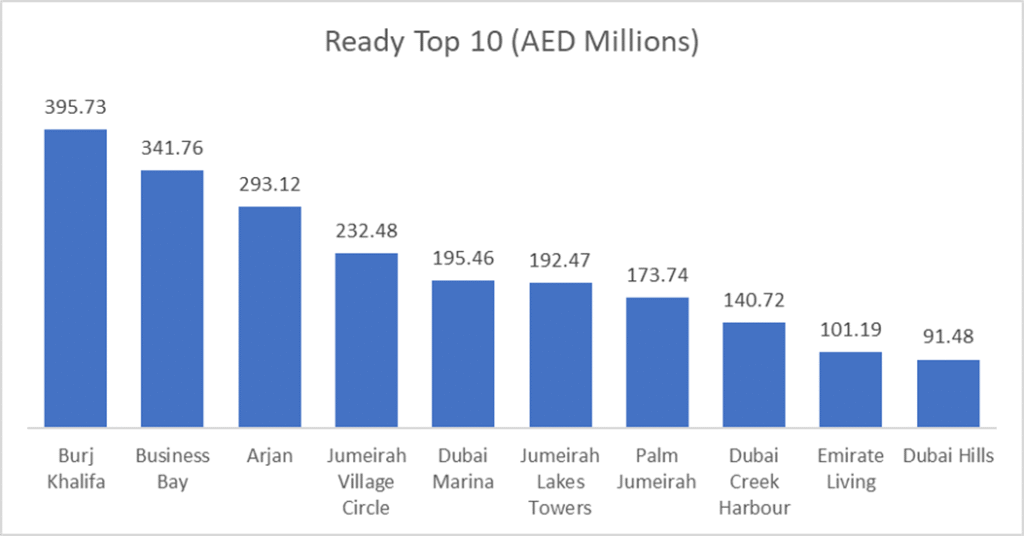
The ready segment was less concentrated than off plan, with the top 10 areas accounting for ~55.2% of ready value. Burj Khalifa and Business Bay led the week (combined 18.8%), showing that prime, high-liquidity nodes still drive a large share of secondary market trading.
On the Micro Level
Weekly Comparison
| Metric | Last Week | This Week | Change |
| Total Value | AED 10.38B | AED 11.55B | +AED 1.16B (+11.2%) |
| Transactions | 4,207 | 4,896 | +689 (+16.4%) |
Market Insights & Outlook
Week 3 accelerated meaningfully on both value and volume, with transactions rising faster than value, often a sign of wider buyer participation rather than a handful of blockbuster deals. Off-plan remained the main engine (66.2%), and the area concentration suggests developers’ launch activity (and buyer attention) is clustering in a few high-momentum districts, especially Business Bay. Meanwhile, the ready market remained anchored in established prime and high-turnover communities, with a smoother spread across the top areas than off-plan.
Data Source: Dubai Land Department