

- April 22, 2026
- 4
- News&Media
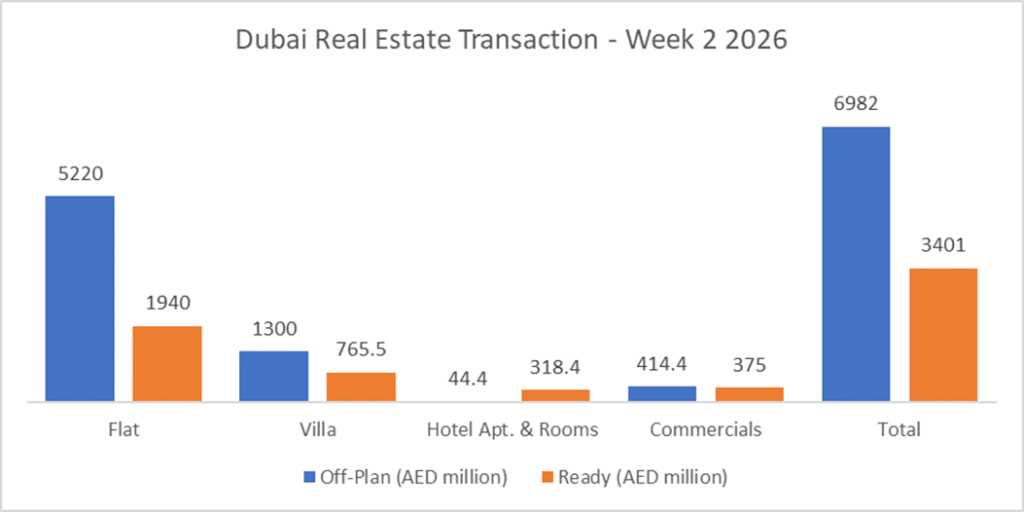
The total real estate transactions in Dubai for Week 2 were AED 10.38 billion and 4,207 transactions. Off-Plan contributed 67.2% or 6.98 billion, while Ready properties contributed 32.8% or 3.40 billion.
Total trading reached AED 10.38bn across 4,207 transactions. Off-Plan dominated with AED 6.98bn (67.2%), while Ready contributed AED 3.40bn (32.8%).
| Category | Off-Plan (AED million) | Ready (AED million) |
| Flat | 5220 | 1940 |
| Villa | 1300 | 765.5 |
| Hotel Apt. & Rooms | 44.4 | 318.4 |
| Commercials | 414.4 | 375 |
| Total | 6982 | 3401 |
Off-Plan Market Performance
Total Value: AED 6.98bn
Share of Weekly Total: 67.2%
Off-plan activity was flat-led, with apartments accounting for nearly three-quarters of off-plan value, reinforcing the market’s preference for scalable, high-liquidity unit types.
| Off-Plan Category | Value | % of Off-Plan |
| Flat | AED 5.22bn | 74.8% |
| Villa | AED 1.30bn | 18.6% |
| Hotel Apt. & Rooms | AED 44.4m | 0.6% |
| Commercials | AED 414.4m | 5.9% |
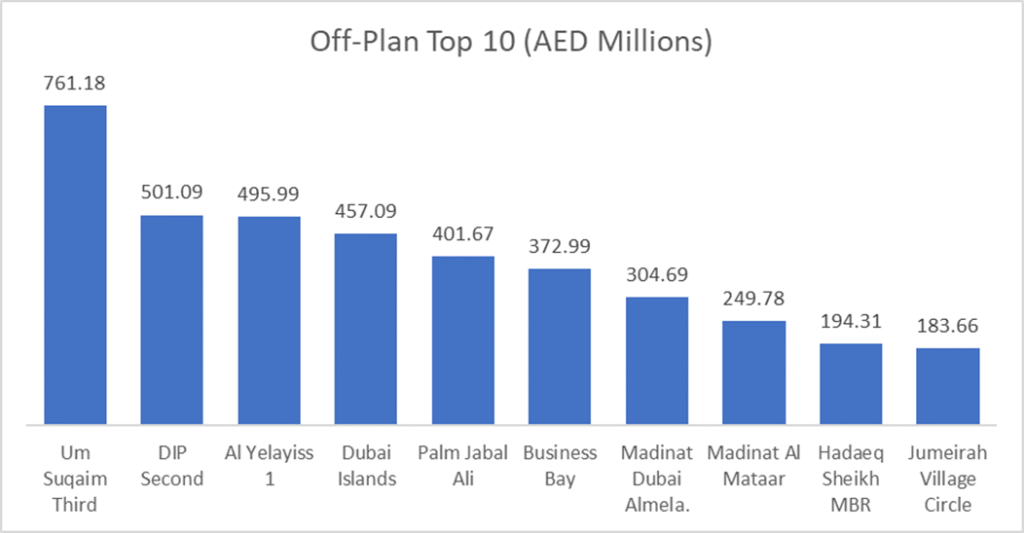
Top Performing Off-Plan Areas By Value
The areas below represent the most active off-plan locations by value traded. The top 10 contributed AED 3.92bn, equal to 56.2% of total off plan value this week.
| Area | Value | % of Off-Plan |
| Um Suqaim Third | AED 761.2m | 10.9% |
| DIP Second | AED 501.1m | 7.2% |
| Al Yelayiss 1 | AED 496.0m | 7.1% |
| Dubai Islands | AED 457.1m | 6.5% |
| Palm Jabal Ali | AED 401.7m | 5.8% |
Ready Market Performance
Total Value: AED 3.40bn
Share of Weekly Total: 32.8%
Ready market value was led by flats (57.1%) but stood out for a meaningfully larger share of Hotel Apt. & Rooms (9.4%) compared with off-plan (0.6%), signalling stronger secondary-market turnover in hospitality-linked inventory this week.
| Ready Category | Value | % of Ready |
| Flat | AED 1.94bn | 57.1% |
| Villa | AED 765.5m | 22.5% |
| Hotel Apt. & Rooms | AED 318.4m | 9.4% |
| Commercials | AED 375.0m | 11.0% |
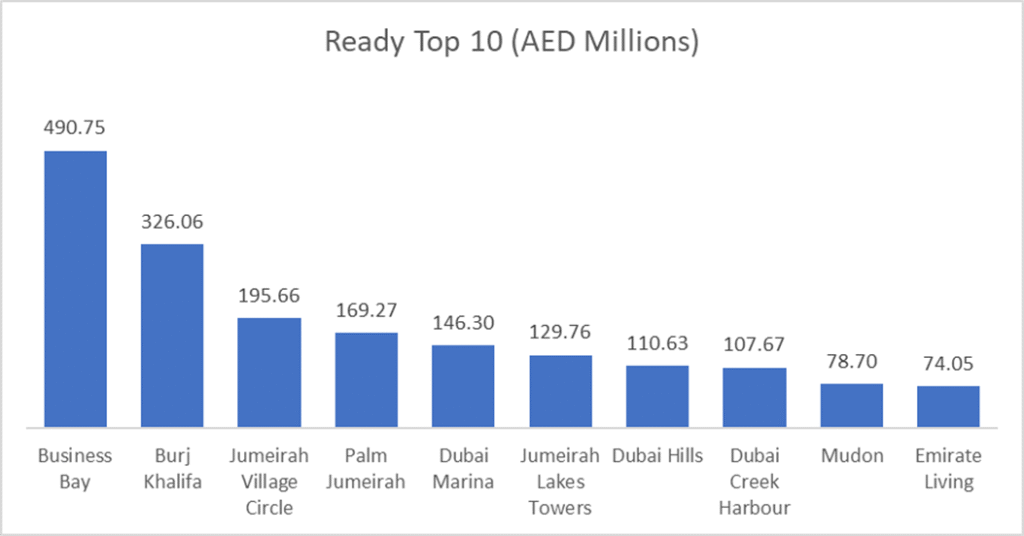
Top Performing Ready Areas By Value
The top 10 ready areas recorded AED 1.83bn, representing 53.8% of total ready value this week, showing a concentrated secondary market led by established prime and high-liquidity locations.
| Area | Value | % of Ready |
| Business Bay | AED 490.8m | 14.4% |
| Burj Khalifa | AED 326.1m | 9.6% |
| Jumeirah Village Circle | AED 195.7m | 5.8% |
| Palm Jumeirah | AED 169.3m | 5.0% |
| Dubai Marina | AED 146.3m | 4.3% |
On the Micro Level
Weekly Comparison (YoY)
| Metric | Week 2 2025 | This Week | Change |
| Total Volume | AED 6.22bn | AED 10.38bn | +AED 4.16bn (+66.9%) |
| Total Transactions | 2,971 | 4,207 | +1,236 (+41.6%) |
Market Insights & Outlook
This week delivered a clear YoY expansion in both value and activity, with total trading rising to AED 10.38bn and transactions reaching 4,207. The growth was led by off-plan (67.2% of value), where flats alone contributed 74.8% of off-plan value, highlighting continued momentum in the unit-driven primary market.
In the ready market, value remained substantial at AED 3.40bn, with demand concentrated in high-liquidity hubs, notably Business Bay and Burj Khalifa, and a stronger contribution from Hotel Apt. & Rooms (9.4%), suggesting active turnover in yield-linked assets and branded/hospitality-style stock.
Overall, the market’s shape this week is defined by primary-market depth (off-plan flats) combined with selective secondary-market strength in prime addresses, a mix that typically supports continued volume resilience, especially if new launches and prime resale inventory remain aligned with end-user and investor demand.
Data Source: Dubai Land Department