

- April 21, 2026
- 2
- News&Media
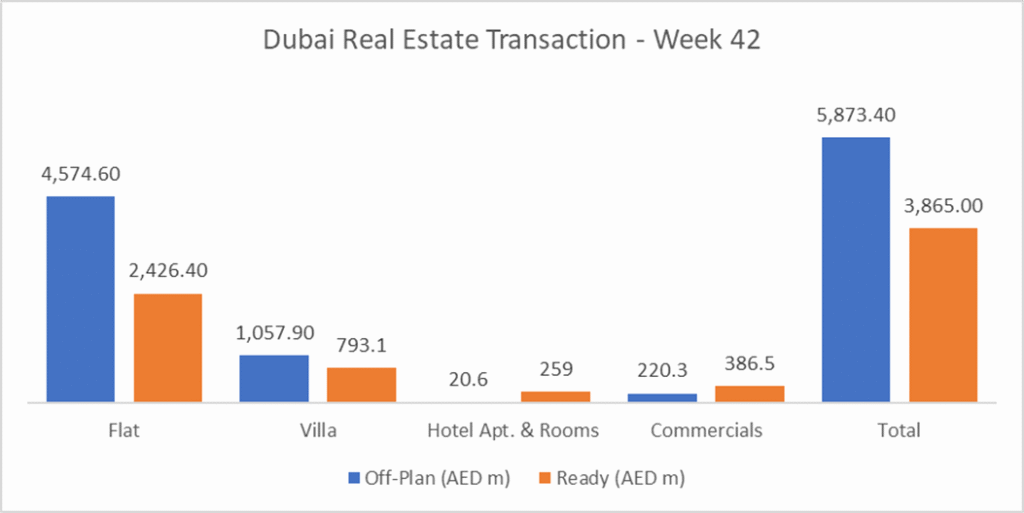
The total real estate transactions in Dubai for Week 42 were AED 9.74 billion and 4,760 transactions. Off plan contributed 60.3% or 5.87 billion, while Ready properties contributed 39.7% or 3.86 billion.
In week 42, the total trading reached AED 9.74 billion across 4,760 transactions. ~1% decline in value and 3% decrease in number of transactions from last week’s numbers. Off-plan contributed AED 5.87 billion (60.3%), while Ready accounted for AED 3.86 billion (39.7%).
| Category | Off-Plan (AED million) | Ready (AED million) |
| Flat | 4,574.6 | 2,426.4 |
| Villa | 1,057.9 | 793.1 |
| Hotel Apt. & Rooms | 20.6 | 259.0 |
| Commercials | 220.3 | 386.5 |
| Total | 5,873.4 | 3,865.0 |
Off-Plan Market Performance
Total Value: AED 5.87 bn
Share of Weekly Total: 60.3%
- Flat: AED 4.57 bn (77.9% of Off-Plan)
- Villa: AED 1.06 bn (18.0% of Off-Plan)
- Hotel Apt. & Rooms: AED 20.6 m (0.4% of Off-Plan)
- Commercials: AED 220.3 m (3.8% of Off-Plan)
Off-plan momentum stayed flat-led, with apartments delivering nearly 78% of off-plan value; villas added a further 18%, while commercial and hospitality remained niche.
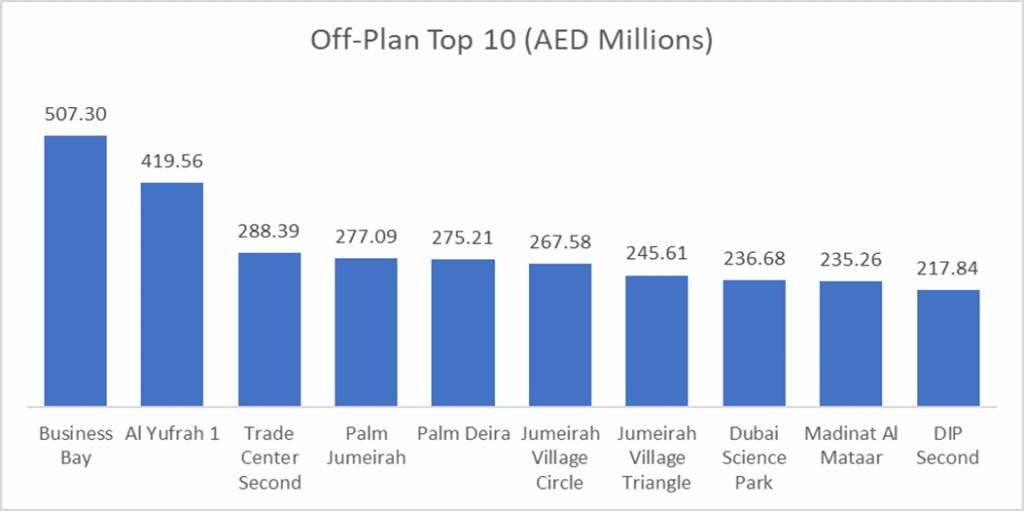
Top Performing Off-Plan Areas (by value)
| Area | Value (AED m) |
| Business Bay | 507.3 |
| Al Yufrah 1 | 419.6 |
| Trade Center Second | 288.4 |
| Palm Jumeirah | 277.1 |
| Palm Deira | 275.2 |
Ready Market Performance
Total Value: AED 3.86 bn
Share of Weekly Total: 39.7%
- Flat: AED 2.43 bn (62.8% of Ready)
- Villa: AED 793.1 m (20.5% of Ready)
- Hotel Apt. & Rooms: AED 259.0 m (6.7% of Ready)
- Commercials: AED 386.5 m (10.0% of Ready)
Ready transactions were dominated by apartments (63%) with steady villa activity (~21%); commercial deals contributed a notable 10%, indicating healthy end-user and investor demand.
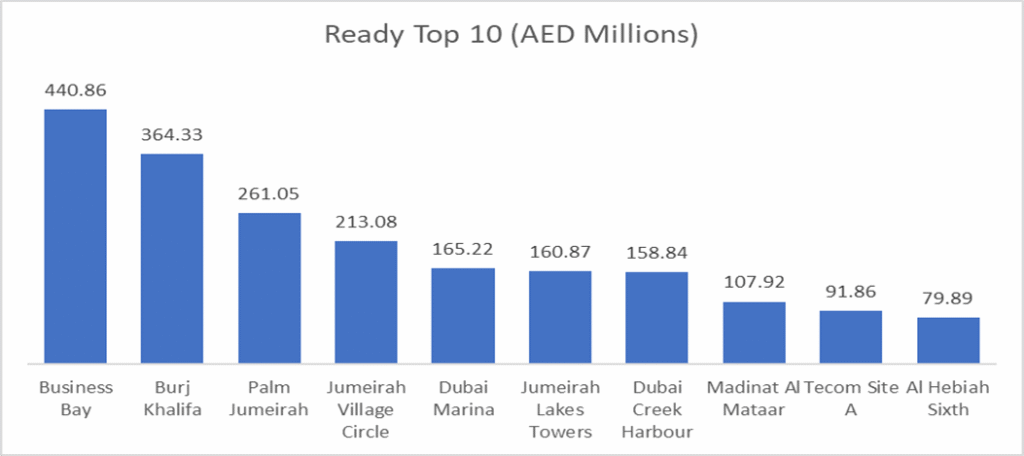
Top Performing Ready Areas (by value)
| Area | Value (AED m) |
| Business Bay | 440.9 |
| Burj Khalifa | 364.3 |
| Palm Jumeirah | 261.1 |
| Jumeirah Village Circle | 213.1 |
| Dubai Marina | 165.2 |
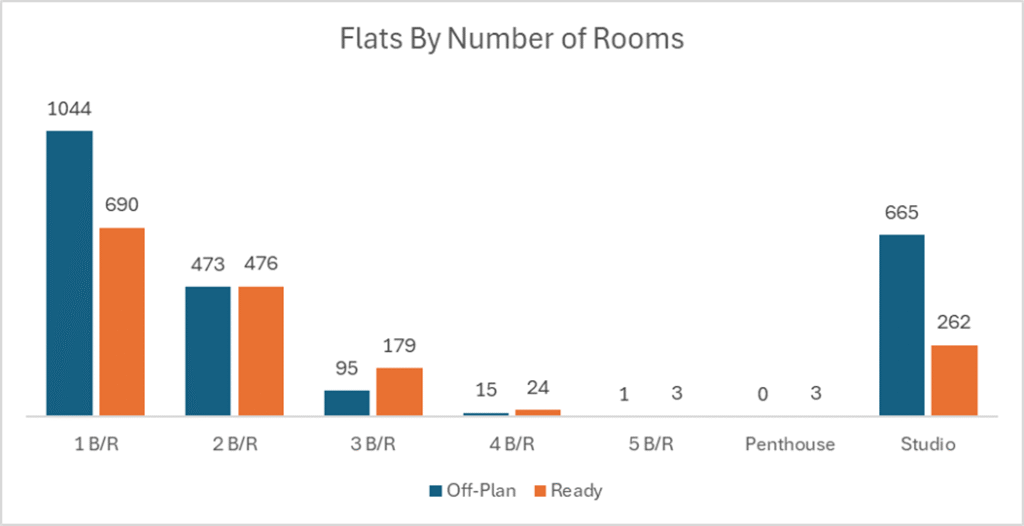
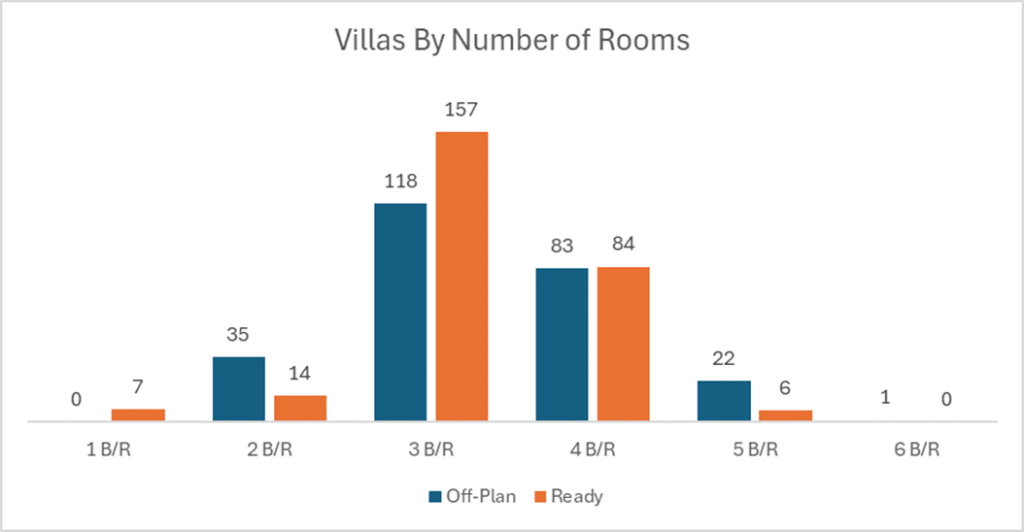
On the micro level
Below is the sales distribution based on the number of bedrooms
Weekly Comparison
| Metric | Last Week | This Week | Change |
| Total Volume | AED 9.82 bn | AED 9.74 bn | −0.8% |
| Number of Transactions | 4,932 | 4,760 | −3.5% |
Market Insights & Outlook
Liquidity eased marginally week-on-week (−0.8%), with activity counts also softer (−3.5%). The demand mix remains apartment-heavy across both Off-Plan (78% of segment value) and Ready (63%), while Business Bay led value traded in both segments, signaling persistent core-CBD appeal. Watch for continued depth in waterfront and Downtown-adjacent submarkets (Palm, Burj Khalifa, Creek Harbour) as developers time end-of-year launches and buyers lock pricing ahead of potential 2026 handovers.
Data Source: Dubai Land Department