

- April 21, 2026
- 2
- News&Media
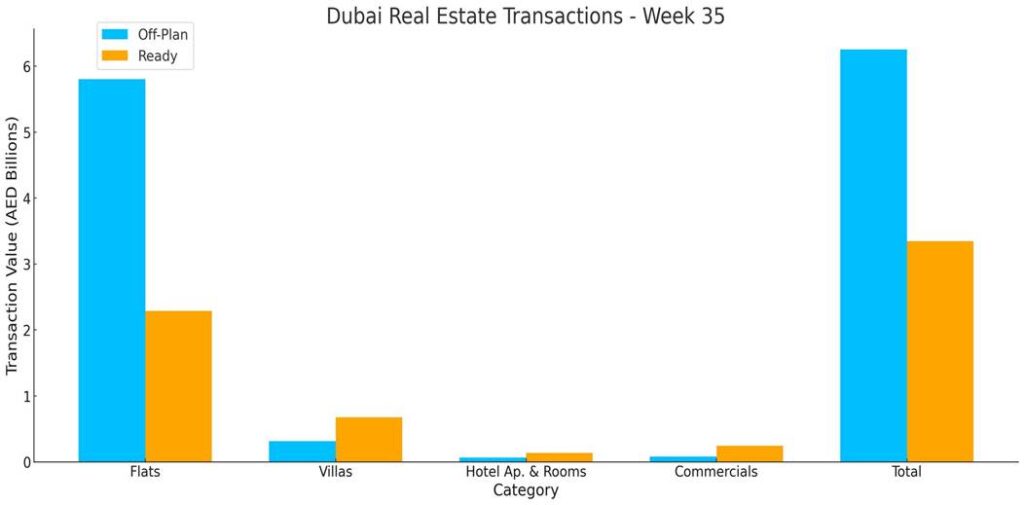
The total real estate transactions in Dubai for Week 35 was AED 9.60 billion and 4,942 transactions. Off-plan contributed 65.2% or 6.26 billion, while Ready properties contributed 34.8% or 3.35 billion.
Total trading reached AED 9.60 billion across 4,942 transactions, a -5.2% drop in value and -4.7% decline in activity versus last week (AED 10.12 billion, 5,188 deals). Off-plan dominated by value with a 65.2% share (AED 6.26 billion), while ready assets contributed 34.8% (AED 3.35 billion).
| Category | Off-Plan (AED millions) | Ready (AED millions) |
| Flat | 5,799.8 | 2,289.3 |
| Villa | 313.5 | 674.2 |
| Hotel Apt. & Rooms | 63.4 | 136.0 |
| Commercials | 78.5 | 246.4 |
| Total | 6,255.3 | 3,346.0 |
Off-Plan Market Performance
- Total Value: AED 6.26 billion
- Share of Weekly Total: 65.2%
| Sub-category | Value (AED millions) | % of Off-Plan |
| Flat | 5,799.8 | 92.7% |
| Villa | 313.5 | 5.0% |
| Hotel Apt. & Rooms | 63.4 | 1.0% |
| Commercials | 78.5 | 1.3% |
| Total | 6,255.3 | 100% |
Off-plan activity was overwhelmingly driven by flats (92.7%), with modest contributions from villas (5.0%) and small tails from commercial and hospitality.
Top Performing Off-Plan Areas (by value traded)
| Area | Value (AED millions) |
| Trade Center Second | 878.8 |
| Business Bay | 572.6 |
| Madinat Dubai Almelaheya | 383.6 |
| Dubai Maritime City | 347.3 |
| DMCC-EZ2 | 268.8 |
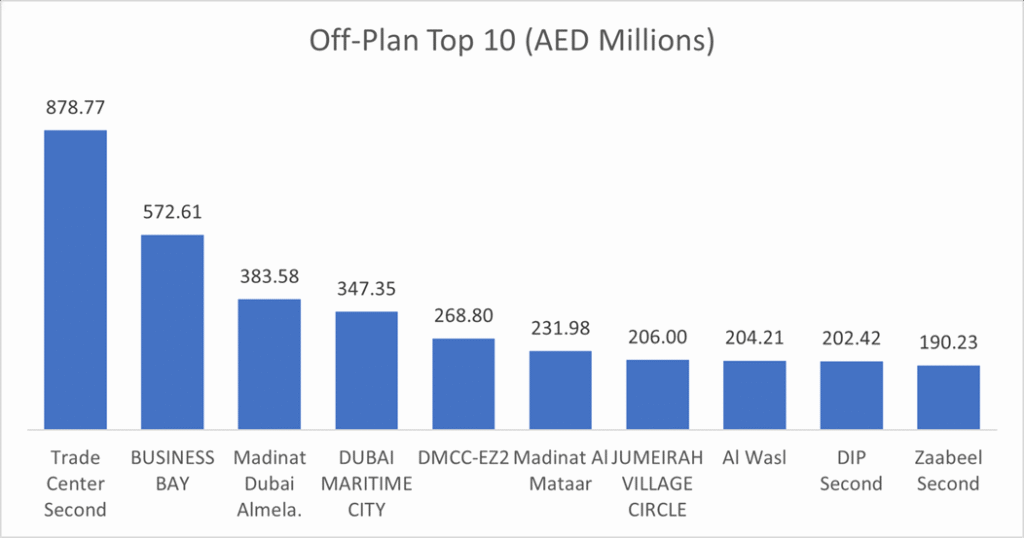
These top10 off-plan areas together accounted for 55.7% of all off-plan value this week. Trade Center Second alone contributed 14.0% of the off-plan market, with Business Bay (9.2%) and Dubai Maritime City (5.6%) also key magnets for new-build demand.
Ready Market Performance
- Total Value: AED 3.35 billion
- Share of Weekly Total: 34.8%
| Sub-category | Value (AED millions) | % of Ready |
| Flat | 2,289.3 | 68.4% |
| Villa | 674.2 | 20.2% |
| Hotel Apt. & Rooms | 136.0 | 4.1% |
| Commercials | 246.4 | 7.4% |
| Total | 3,346.0 | 100% |
The ready market was led by flats (68.4%), with villas (20.2%) forming the second pillar. Commercials and hospitality were smaller but steady contributors.
Top Performing Ready Areas (by value traded)
| Area | Value (AED millions) |
| Business Bay | 553.7 |
| Burj Khalifa | 319.2 |
| Dubai Marina | 184.1 |
| JVC | 168.9 |
| JLT | 147.2 |
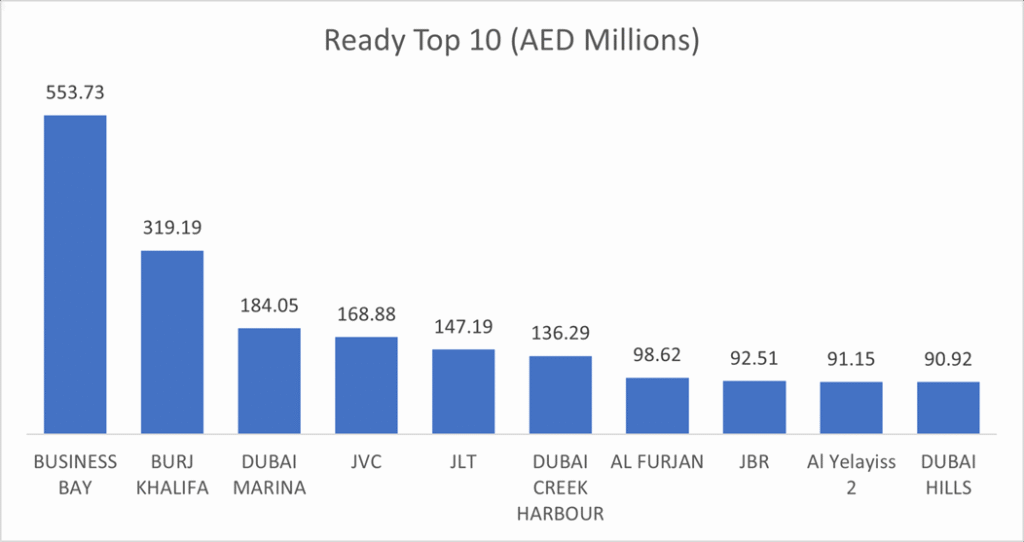
The top10 ready areas captured 56.3% of ready value. Business Bay (16.5% of ready) led decisively, followed by Burj Khalifa (9.5%).
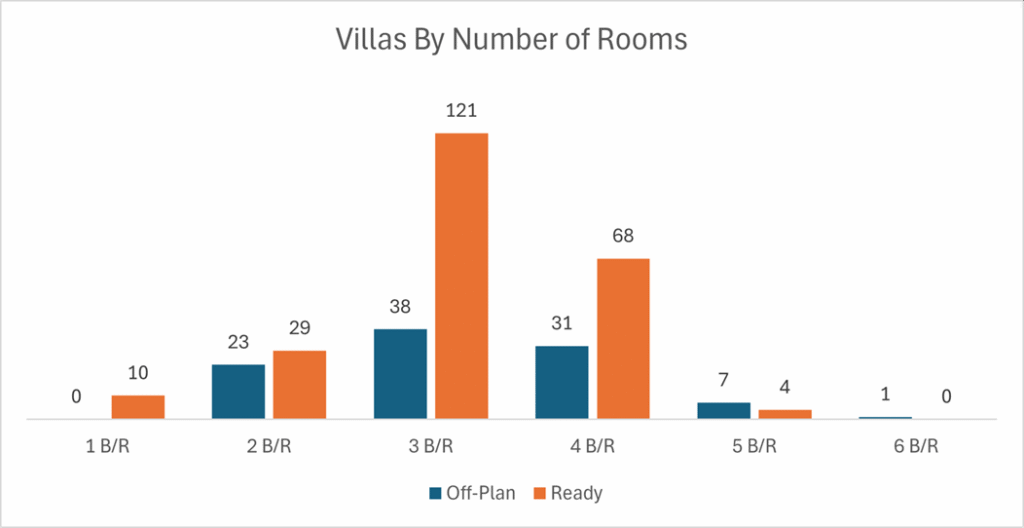
On the micro level, below is the sales distribution based on the number of bedrooms
Weekly Comparison
| Metric | Last Week (AED billions) | This Week (AED billions) | Change |
| Total Volume | 10.12 | 9.60 | -5.2% |
| Transactions | 5,188 | 4,942 | -4.7% |
Market Insights & Outlook
- Softer headline week: Both value and deal count eased WoW after a strong prior print; the mix remains resilient, with off-plan holding a 65% share.
- Apartment-led dynamic: Flats continue to be the engine, 93% of off-plan and 68% of ready value.
- Geographic concentration: New-build capital clustered in Trade Center Second and Business Bay; ready liquidity centered on Business Bay and Burj Khalifa, with steady flows in Dubai Marina, JVC, and JLT.
- Near-term view: Expect off-plan to maintain a 65–70% share as launch pipelines stay active, while ready volumes should remain focused in prime mixed-use corridors where rental resilience and lifestyle amenities anchor demand.