

- April 21, 2026
- 5
- News&Media
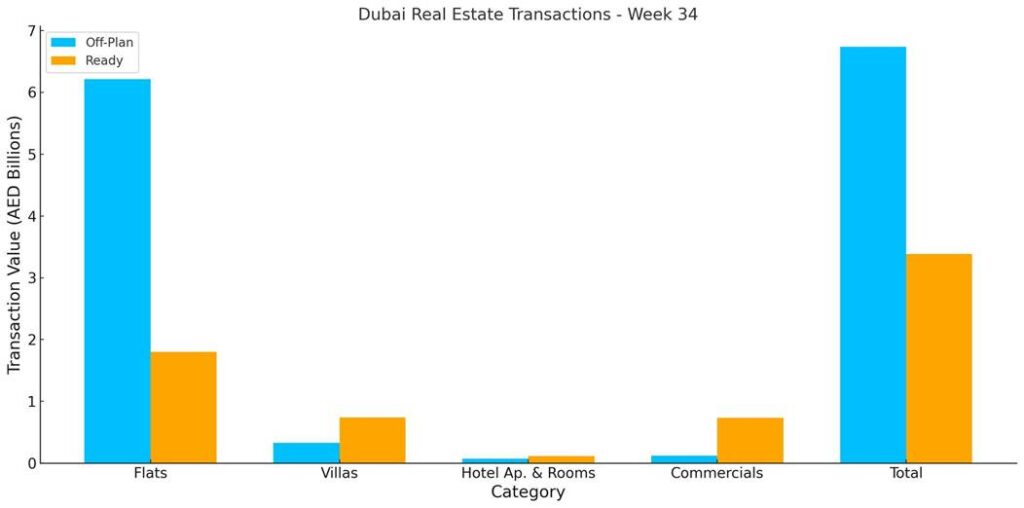
The total real estate transactions in Dubai for Week 34 was AED 10.12 billion and 5,188 transactions. Off-plan contributed 66.6% or 6.7 billion, while Ready properties contributed 33.4% or 3.4 billion.
Total trading reached AED 10.12 billion across 5,188 transactions, a +10.5% jump in value and +4.6% rise in activity versus last week (AED 9.16 billion, 4,961 deals). Off-plan dominated by value with a 66.6% share (AED 6.74 billion), while ready assets contributed 33.4% (AED 3.39 billion).
| Category | Off-Plan (AED billion) | Ready (AED billion) |
| Flat | 6.22 | 1.80 |
| Villa | 0.33 | 0.74 |
| Hotel Apts & Rooms | 0.07 | 0.11 |
| Commercials | 0.12 | 0.73 |
| Total | 6.74 | 3.39 |
Off-Plan Market Performance
- Total Value: AED 6.74 billion
- Share of Weekly Total: 66.6%
| Sub-category | Value (AED millions) | % of Off-Plan |
| Flat | 6,216.3 | 92.3% |
| Villa | 329.9 | 4.9% |
| Hotel Apt. & Rooms | 70.6 | 1.0% |
| Commercials | 120.5 | 1.8% |
| Total | 6,737.4 | 100% |
Off-plan activity was overwhelmingly driven by flats (92.3%), with modest contributions from villas (4.9%) and small tails from commercial and hospitality.
Top Performing Off-Plan Areas (by value traded)
| Area | Value (AED millions) |
| Business Bay | 895.5 |
| Dubai Science Park | 364.8 |
| Hadaeq Sheikh MBR | 334.9 |
| Jumeirah Village Circle | 329.8 |
| DMCC-EZ2 | 303.5 |
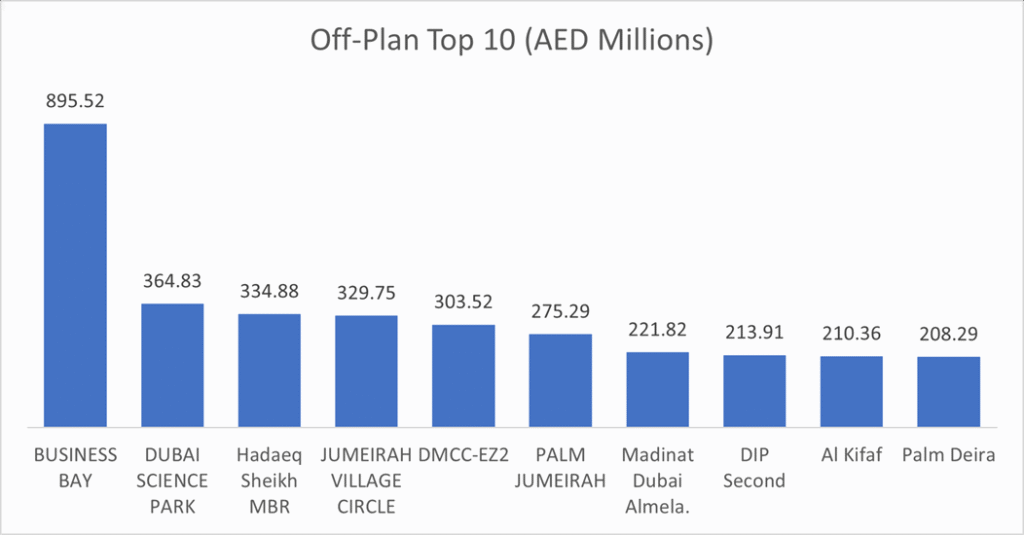
These top 10 off-plan areas together accounted for 49.8% of all off-plan value this week. Business Bay alone contributed 13.3% of the off-plan market, with Dubai Science Park (5.4%) and Hadaeq Sheikh MBR (5.0%) following.
Ready Market Performance
- Total Value: AED 3.39 billion
- Share of Weekly Total: 33.4%
| Sub-category | Value (AED millions) | % of Ready |
| Flat | 1,800.2 | 53.2% |
| Villa | 741.9 | 21.9% |
| Hotel Apt. & Rooms | 112.3 | 3.3% |
| Commercials | 731.2 | 21.6% |
| Total | 3,385.6 | 100% |
The ready market was led by flats (53.2%), while commercials (21.6%) and villas (21.9%) provided meaningful secondary pillars—an unusually balanced split for ready stock.
Top Performing Ready Areas (by value traded)
| Area | Value (AED millions) |
| City Walk | 427.8 |
| Burj Khalifa | 308.2 |
| Business Bay | 236.5 |
| Palm Jumeirah | 211.5 |
| Jumeirah Lakes Towers | 179.5 |
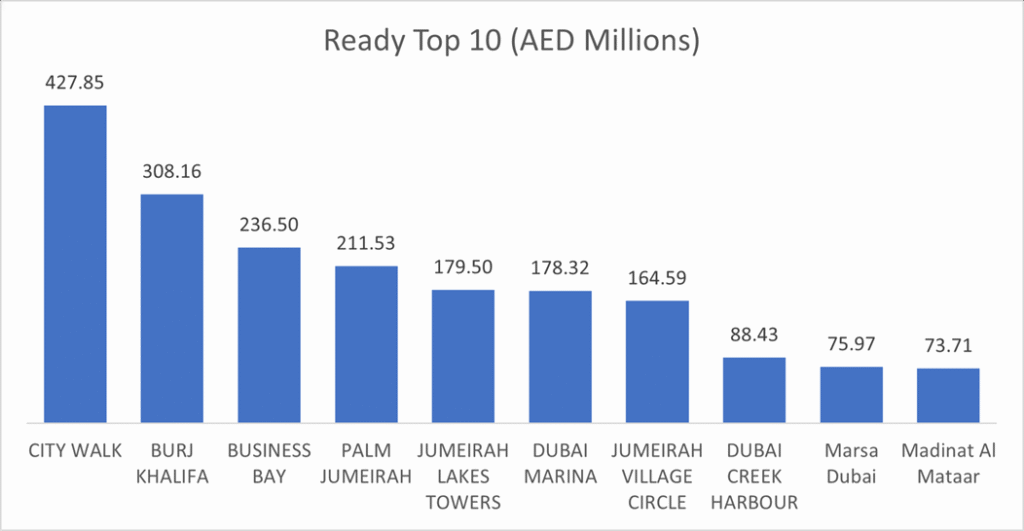
The top 10 ready areas captured 57.4% of ready value. City Walk (12.6% of ready) led the board, with Burj Khalifa (9.1%) and Business Bay (7.0%) close behind, signaling demand concentration in prime, amenity-rich mixed-use districts.
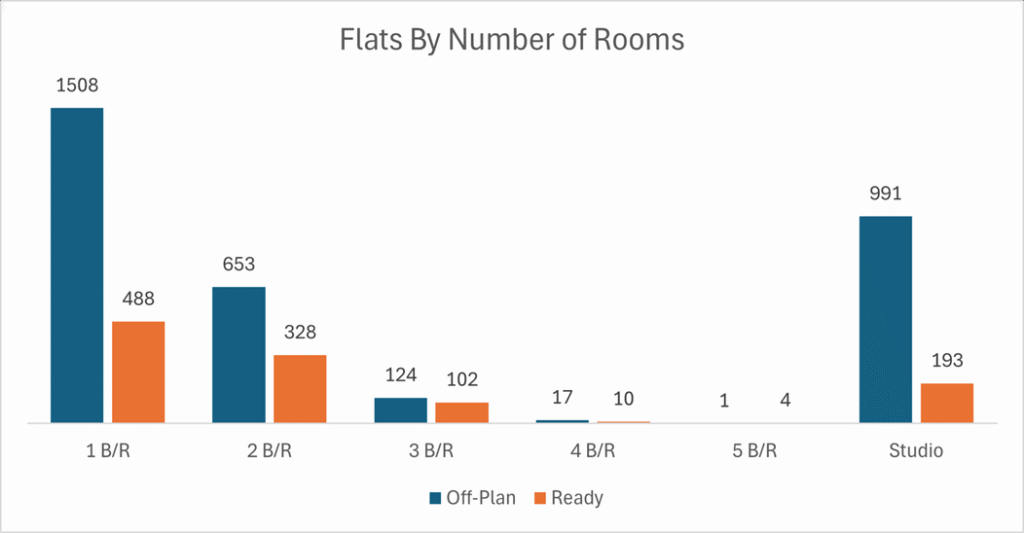
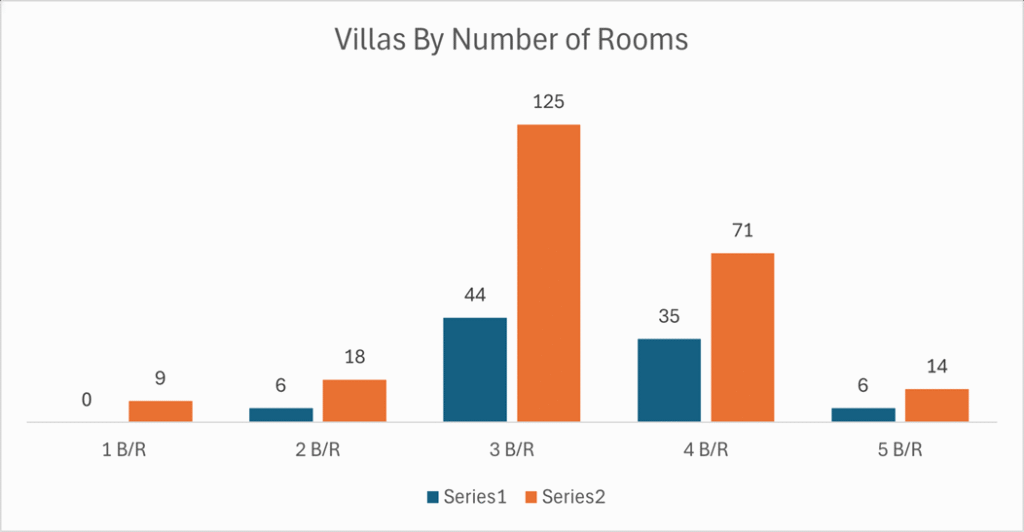
On the micro level, below is the sales distribution based on the number of bedrooms
Weekly Comparison
| Metric | Last Week | This Week | Change |
| Total Volume | 9.16 (AED, billions) | 10.12 (AED, billions) | +10.5% |
| Transactions (count) | 4,961 (AED, billions) | 5,188 (AED, billions) | +4.6% |
Market Insights & Outlook
- Momentum tick-up: Week-on-week gains in both value and deal count indicate a healthy breadth of demand, with off-plan continuing to set the pace.
- Off-plan concentration: Flats remain the engine of new-build trading (over 92% of off-plan value), anchored by Business Bay and emerging innovation clusters (Dubai Science Park, DMCC-EZ2).
- Ready diversification: The ready market shows a balanced split between flats and commercials, with prestige addresses (City Walk, Burj Khalifa) and core business nodes (Business Bay, JLT, Dubai Marina) attracting capital.
- Near-term view: With headline launches and strong absorption in central and innovation-led corridors, we expect off-plan to retain a ~65–70% share of weekly value, while ready volumes should continue to concentrate in prime mixed-use and lifestyle districts as end-users and investors chase rental resilience.