

- April 21, 2026
- 1
- News&Media
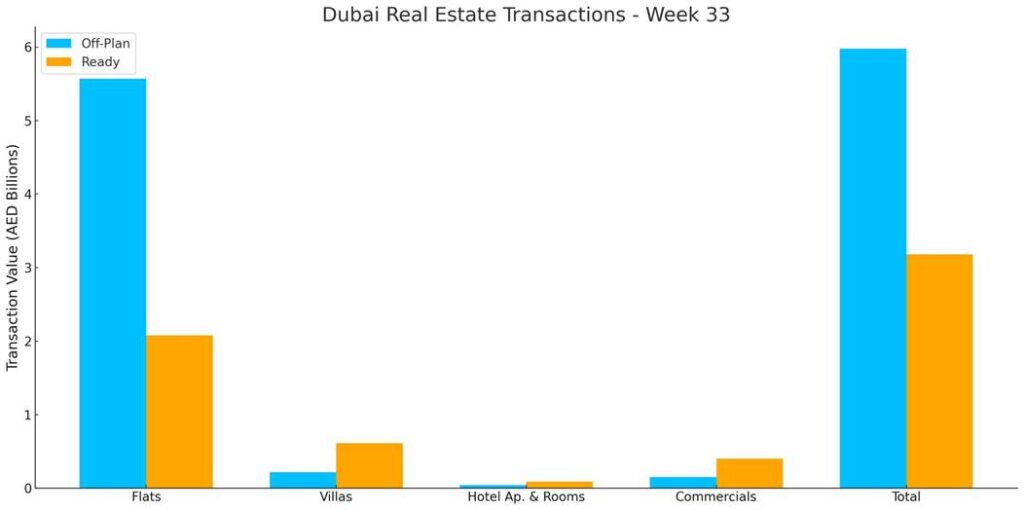
The total real estate transactions in Dubai for Week 33 was AED 9.16 billion and 4,961 transactions. Off-plan contributed 65.3% or 6.0 billion, while Ready properties contributed 34.7% or 3.18 billion.
On the 33rd week of 2025, Dubai recorded AED 9.159 bn in total transactions, the total value-added AED 36.4 m (+0.4%) above last week’s AED 9.122 bn. Deal activity also rose to 4,961 transactions (+3.6%) from 4,790 a week earlier. Off-plan continued to lead by value at 65.3%, with ready accounting for 34.7%.
| Category | Off-Plan (AED millions) | Ready (AED millions) |
| Flats | 5,567.2 | 2,078.8 |
| Villas | 216.3 | 613.3 |
| Hotel Apartments & Rooms | 42.8 | 88.5 |
| Commercials | 152.6 | 399.2 |
| Total | 5,978.9 | 3,179.8 |
Off-Plan Market Performance
- Total Value: AED 5.979 bn
- Share of Total Value: 65.3%
| Subcategory | Value (AED million) | % of Off-Plan |
| Flats | 5,567.2 | 93.1% |
| Villas | 216.3 | 3.6% |
| Hotel Apartments & Rooms | 42.8 | 0.7% |
| Commercials | 152.6 | 2.6% |
Off-plan activity was overwhelmingly flat-led, with apartments contributing more than nine-tenths of off-plan value. Villas and commercials were modest but steady add-ons.
Top Performing Off-Plan Areas (by Value Traded)
| Area | Value (AED million) |
| Business Bay | 1,072.4 |
| Jumeirah Village Circle | 402.7 |
| Wadi Al Safa 4 | 318.8 |
| DIP Second | 280.4 |
| Dubai Marina | 220.8 |
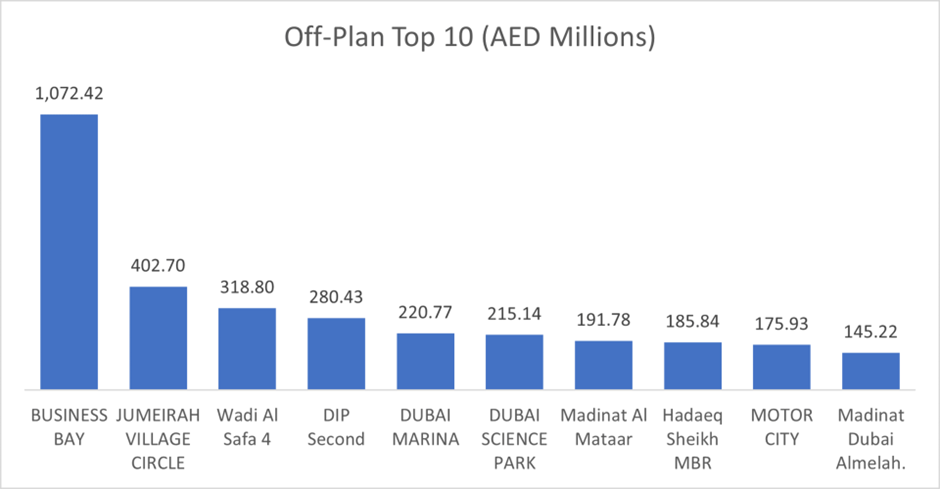
Top 10 off-plan areas captured 53.7% of weekly off-plan value.
Ready Market Performance
- Total Value: AED 3.180 bn
- Share of Total Value: 34.7%
| Subcategory | Value (AED m) | % of Ready |
| Flats | 2,078.8 | 65.4% |
| Villas | 613.3 | 19.3% |
| Hotel Apartments & Rooms | 88.5 | 2.8% |
| Commercials | 399.2 | 12.6% |
Ready transactions were driven by apartments, while villas and commercial assets provided a solid quarter-plus of the segment’s value.
Top Performing Ready Areas (by Value Traded)
| Area | Value (AED m) |
| Burj Khalifa | 444.7 |
| Business Bay | 269.4 |
| Jumeirah Village Circle | 203.9 |
| Jumeirah Lakes Towers | 146.2 |
| Dubai Marina | 141.9 |
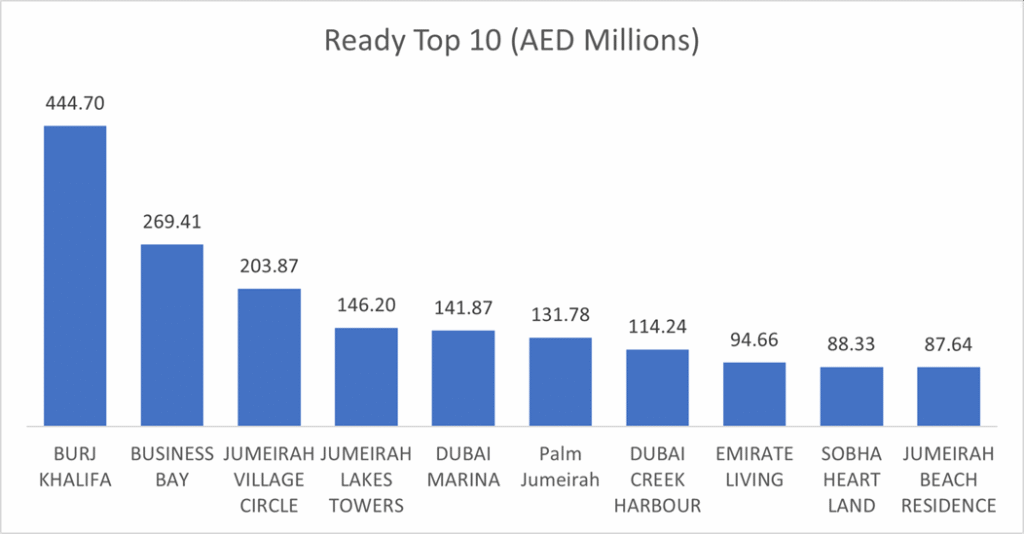
Top 10 ready areas accounted for 54.2% of weekly ready value.
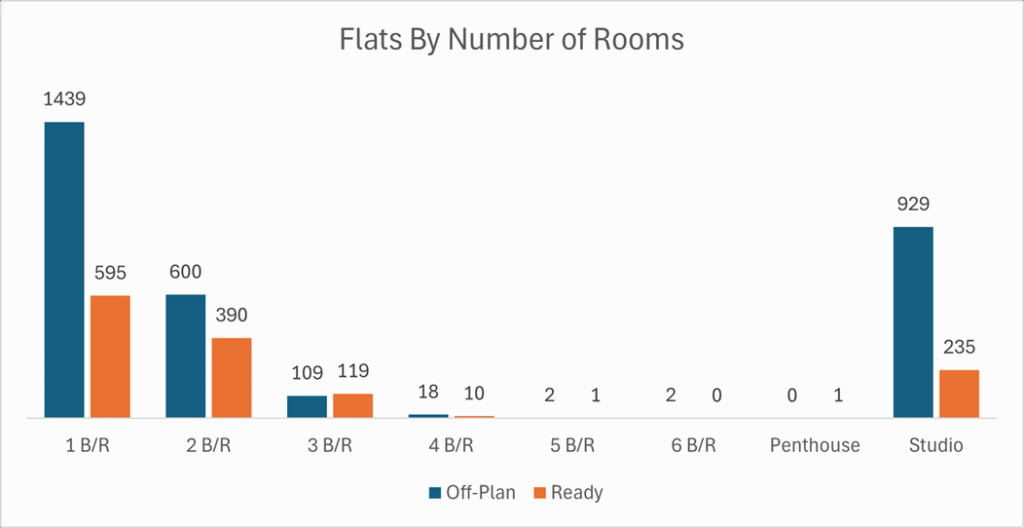
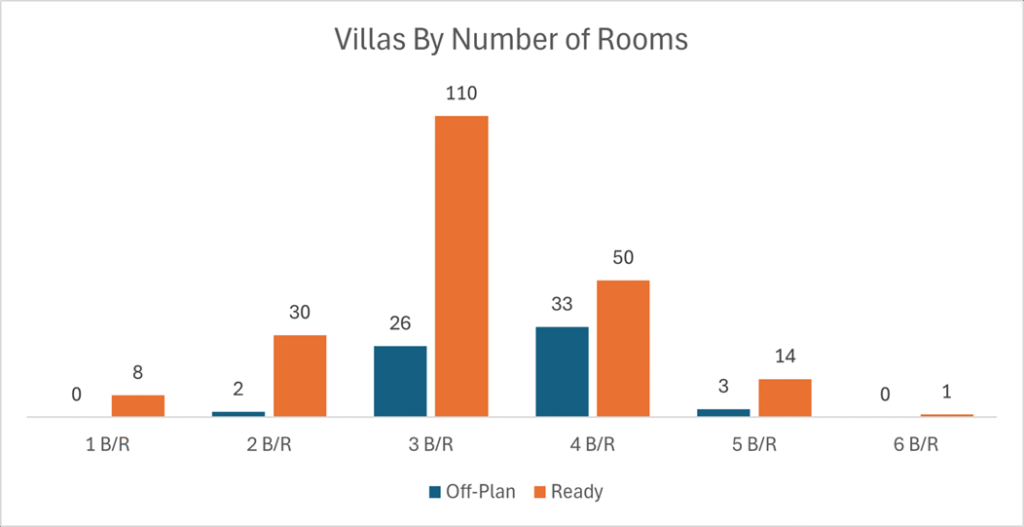
On the micro level, below is the sales distribution based on the number of bedrooms
Weekly Comparison
| Metric | Week 32 | Week 33 | Change |
| Total Volume | AED 9.122 bn | AED 9.159 bn | +AED 0.036 bn (+0.4%) |
| Transactions | 4,790 | 4,961 | +171 (+3.6%) |
Market Insights & Outlook
- Core hubs led the tape. Business Bay dominated both off-plan (Thanks to Binghatti Skyrise) and ready, while Burj Khalifa topped ready value.
- Apartment-heavy mix. Apartments contributed 93% of off-plan and 65% of ready value, confirming depth on the mid-ticket end where buyers are most rate-sensitive yet active.
- Breadth improving. The rise in transactions outpaced value growth, indicating more deals at similar ticket sizes, healthy for liquidity.
- Watchlist. Keep an eye on JVC, Dubai Marina, and Dubai Creek Harbour, each feature in the weekly leaders and should sustain momentum if launches and handovers stay consistent.