

- April 21, 2026
- 3
- News&Media
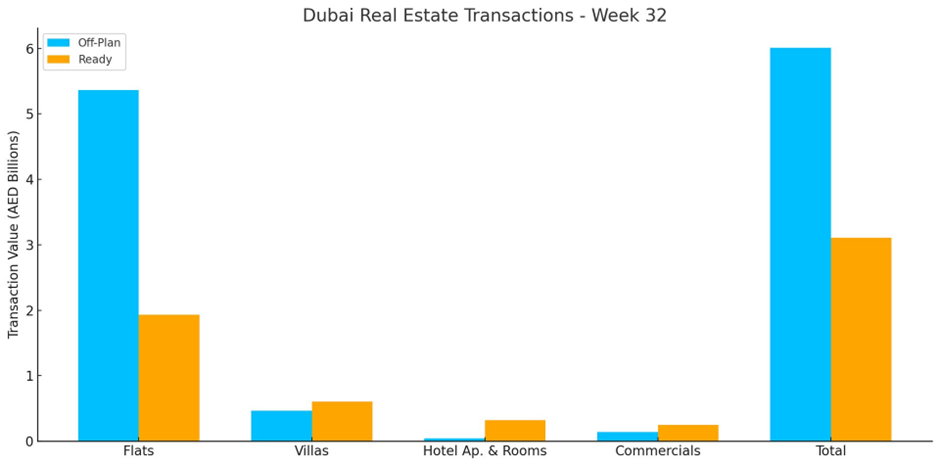
The total real estate transactions in Dubai for Week 32 was AED 9.12 billion and 4,790 transactions. Off-plan contributed 65.9% or 6.01 billion, while Ready properties contributed 34.1% or 3.11 billion.
On the 32nd week of 2025, Dubai’s property market totalled AED 9.12 bn across 4,790 transactions. Down 8.1% from (AED 9.92 bn) last week while transactions are up 5.4% (from 4,543). Off-plan contributed 65.9% of weekly value (AED 6.01 bn) and ready accounted for 34.1% (AED 3.11 bn). The rise in deal counts alongside lower aggregate value points to smaller average ticket sizes week-over-week.
| Category | Off-Plan (AED million) | Ready (AED million) |
| Flat | 5,363.5 | 1,933.0 |
| Villa | 465.7 | 607.2 |
| Hotel Apt. & Rooms | 41.8 | 319.2 |
| Commercials | 141.5 | 250.4 |
| Total | 6,012.5 | 3,109.8 |
Off-Plan Market Performance
- Total Value: AED 6.01 bn
- Share of Weekly Value: 65.9%
| Sub-category | Value (AED million) | % of Off-Plan |
| Flats | 5,363.5 | 89.2% |
| Villas | 465.7 | 7.7% |
| Hotel Apts & Rooms | 41.8 | 0.7% |
| Commercial | 141.5 | 2.4% |
| Total | 6,012.5 | 100% |
Off-plan activity was overwhelmingly flat-led (9 in 10 dirhams), with villas a distant second.
Top Performing Off-Plan Areas (by value traded)
| Area | Value (AED million) |
| Business Bay | 429.0 |
| Wadi Al Safa 4 | 419.9 |
| Hadaeq Sheikh MBR | 375.4 |
| Jumeirah Village Circle | 339.6 |
| DIP Second | 337.5 |
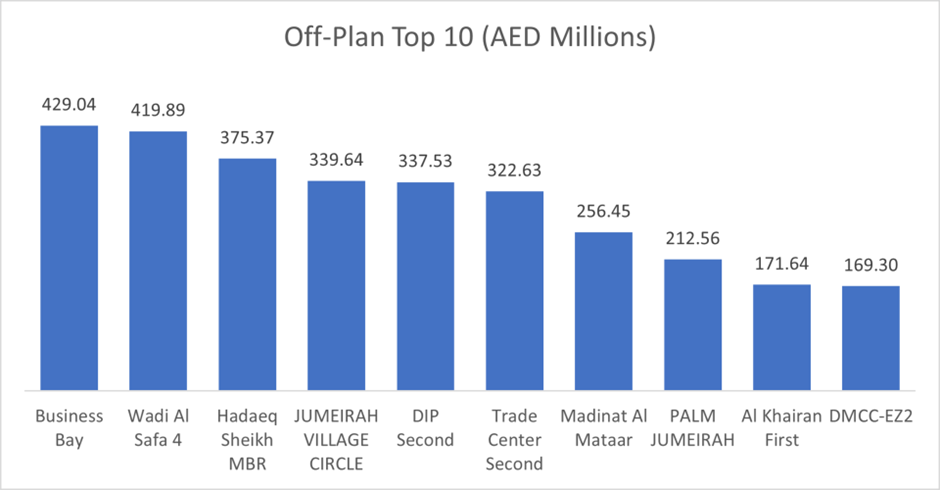
These top ten areas captured 50.5% of all off-plan value this week
Ready Market Performance
- Total Value: AED 3.11 bn
- Share of Weekly Value: 34.1%
| Sub-category | Value (AED million) | % of Ready |
| Flats | 1,933.0 | 62.2% |
| Villas | 607.2 | 19.5% |
| Hotel Apts & Rooms | 319.2 | 10.3% |
| Commercial | 250.4 | 8.1% |
| Total | 3,109.8 | 100% |
Ready deals were also flat-heavy (62%), with villas contributing just under one-fifth.
Top Performing Ready Areas (by value traded)
| Area | Value (AED million) |
| Burj Khalifa | 241.9 |
| Majan | 240.7 |
| Business Bay | 200.8 |
| Jumeirah Lakes Towers | 177.1 |
| Jumeirah Village Circle | 172.4 |
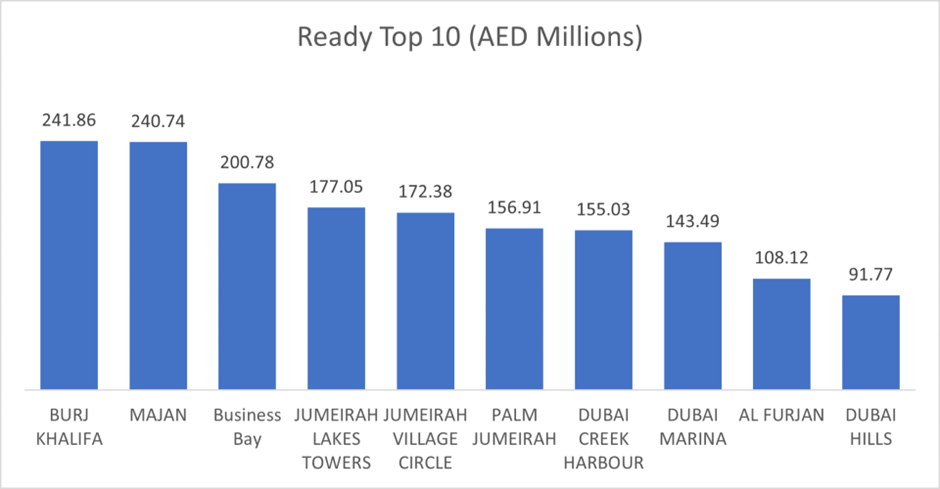
These top ten areas represented 54.3% of ready value this week
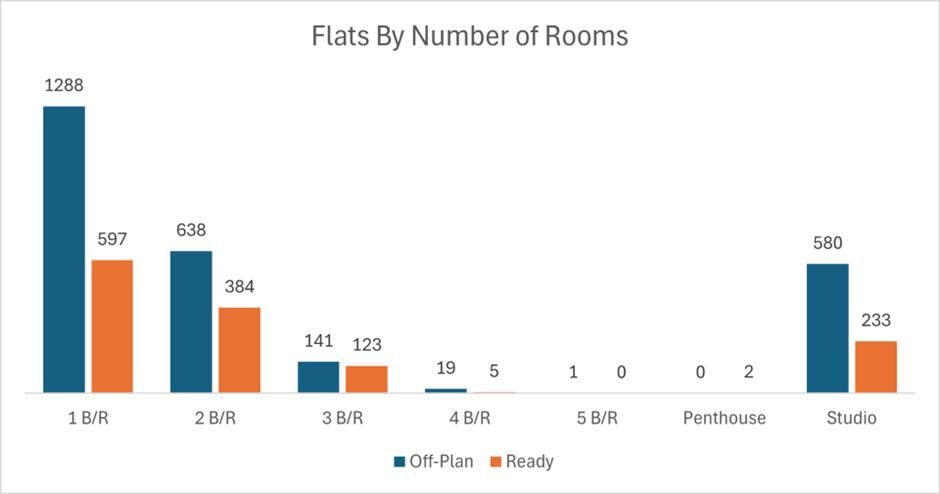
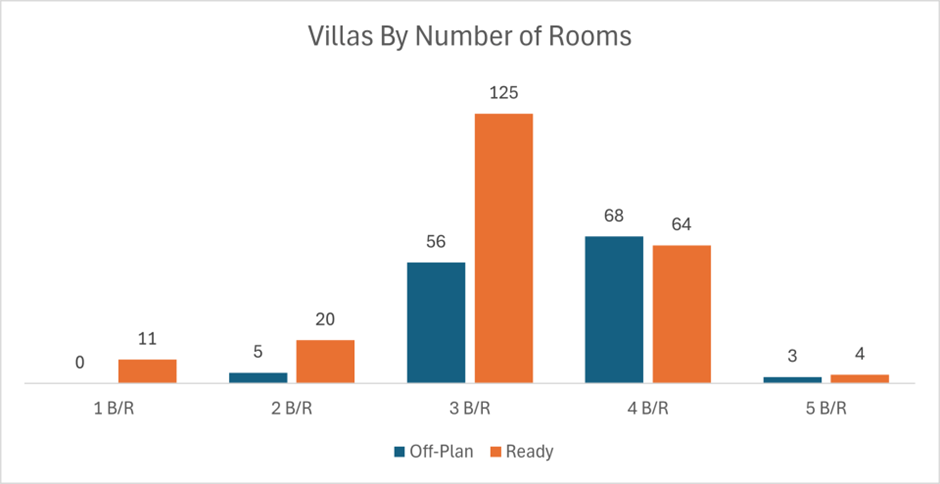
On the micro level, below is the sales distribution based on the number of bedrooms
Weekly Comparison
| Metric | Week 31 | Week 32 | Change |
| Total Value | AED 9.92 bn | AED 9.12 bn | -8.1% |
| Transactions | 4,543 | 4,790 | +5.4% |
Market Insights & Outlook
- Momentum mix: Higher deal count but lower aggregate value suggests demand is tilting toward mid-market inventory and smaller ticket sizes, especially in off-plan flats.
- Geographic concentration: Business Bay led both segments (off-plan leadership and strong ready prints), while Majan and Burj Khalifa stood out on the ready side.
- Segment skew: Off-plan remains the engine (66% share). Given the pipeline and ongoing launches, expect off-plan flats to sustain dominance, with selective villa activity in emerging corridors (e.g., Wadi Al Safa 4).
- What to watch: Launch cadence, payment-plan attractiveness, and mortgage pricing for ready flats (which are driving >60% of ready value) will steer near-term liquidity.