

- April 21, 2026
- 4
- News&Media
Land transactions in July 2025 were 43.2% of the total transactions. The market activity increased by AED 11.7 billion from June 2025, 18.1% MoM. And 26.8% increase YoY.
Dubai closed July 2025 with AED 76.40 billion in property transactions across 24,746 deals. This represents a 18.1% increase month-over-month from June 2025’s AED 64.68 billion but a 26.8% year-on-year increase versus July 2024’s AED 60.25 billion. The number of transactions stood at 24,746, up 20.6% from June’s 20,524 deals.
| Metric | July 2025 | June 2025 | MoM Δ | July 2024 | YoY Δ |
| Total value | AED 76.40 bn | AED 64.68 bn | ▲ 18.1 % | AED 60.25 bn | ▲ 26.8 % |
| Transactions | 24,746 | 20,524 | ▲ 20.6 % | — | — |
Market Composition
| Segment | Value (AED bn) | Share of Total | Key Drivers |
| Land | 33.0 | 43.2 % | Big-ticket plots in Wadi Al Safa 3, Ras Al Khor and DIP Second dominated. |
| Off-Plan | 27.9 | 36.5 % | Flat sales (AED 24.8 bn, 88.9 % of off-plan) carried the segment; villas were a distant second (AED 2.24 bn, 8.0 %). |
| Ready | 15.5 | 20.3 % | Flats led (AED 10.42 bn, 67.2 %), while villas delivered AED 2.98 bn (19.2 %). |
Market Performance
Off-Plan Market Performance
| Sub-category | Value (AED billion) | % of Off-Plan |
| Flats | 24.82 | 88.9 % |
| Villas | 2.24 | 8.0 % |
| Hotel Apt. & Rooms | 0.21 | 0.8 % |
| Commercial | 0.65 | 2.3 % |
Demand for new-build apartments remains overwhelming; nearly nine dirhams out of every ten spent on off-plan went to flats.
Ready Market Performance
| Sub-category | Value (AED bn) | % of Ready |
| Flats | 10.42 | 67.2 % |
| Villas | 2.98 | 19.2 % |
| Hotel Apt. & Rooms | 0.73 | 4.7 % |
| Commercial | 1.38 | 8.9 % |
Secondary-market activity is still apartment-heavy, but villas held almost one-fifth of ready spend as end-users chased immediate handovers.
Top Performing Areas
By Number of Transactions
| Rank | Off-Plan Deals | Deals | Ready Deals | Deals |
| 1 | JVC | 1,077 | JVC | 1,125 |
| 2 | Business Bay | 1,032 | Business Bay | 730 |
| 3 | DIP Second | 801 | Motor City | 417 |
| 4 | Bukadra | 720 | Jumeirah JLT | 408 |
| 5 | Motor City | 609 | Dubai Marina | 389 |
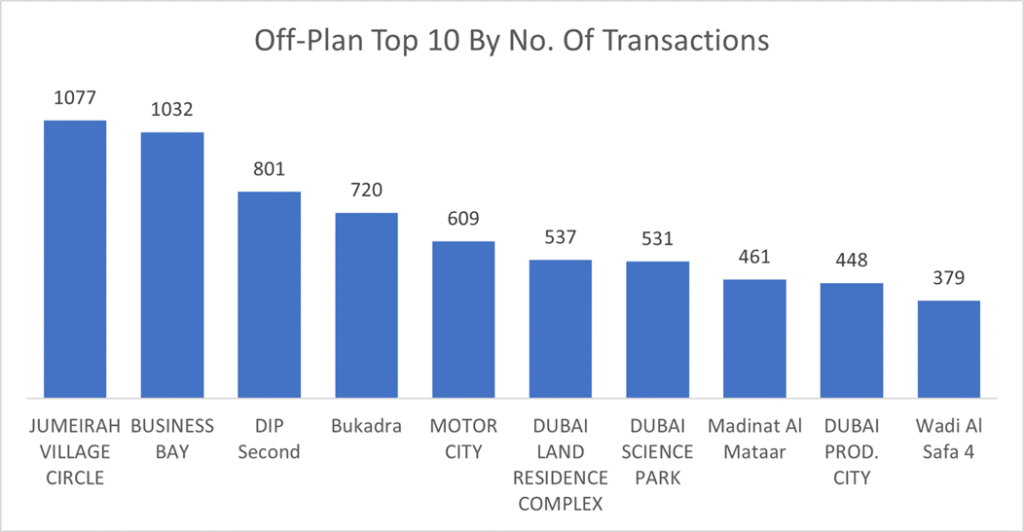
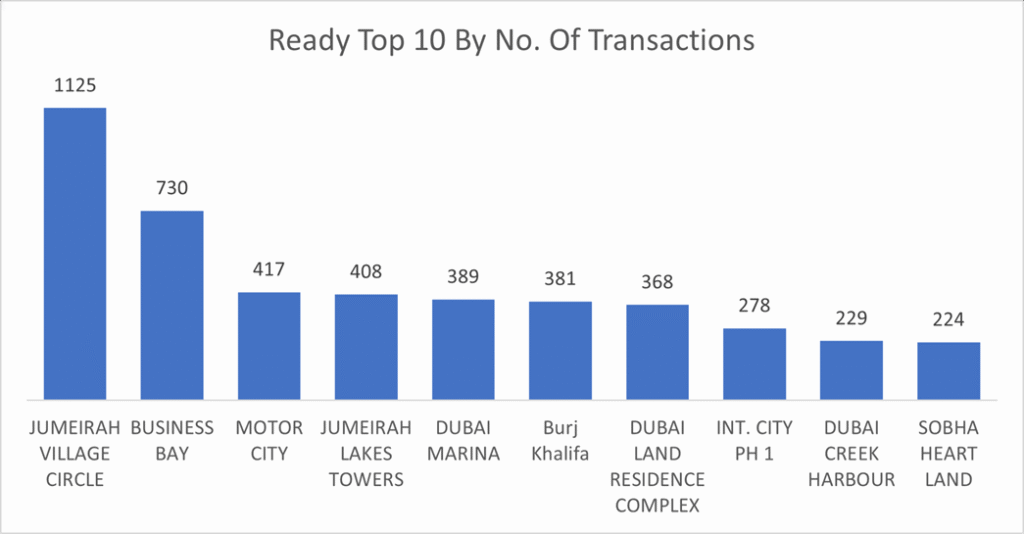
| JVC cemented its reputation as the volume king, topping both off-plan and ready sales counts. |
| The average price per square meter for off-plan flats stood at AED 24,709 almost unchanged from last month, while off-plan villas averaged AED 19,770 a 12.8% increase from last month.h. |
| By Value Traded |
| Rank Off-Plan (AED billion) Value Ready (AED billion) Value 1 Business Bay 2.23 Business Bay 1.45 2 Jumeirah 2 1.74 Burj Khalifa 1.36 3 Bukadra 1.65 JVC 1.17 4 JVC 1.22 Palm Jumeirah 1.02 5 DIP Second 1.09 Dubai Marina 0.88 |
Business Bay dominated value in both segments, underlining its position as Dubai’s most liquid mixed-use district.
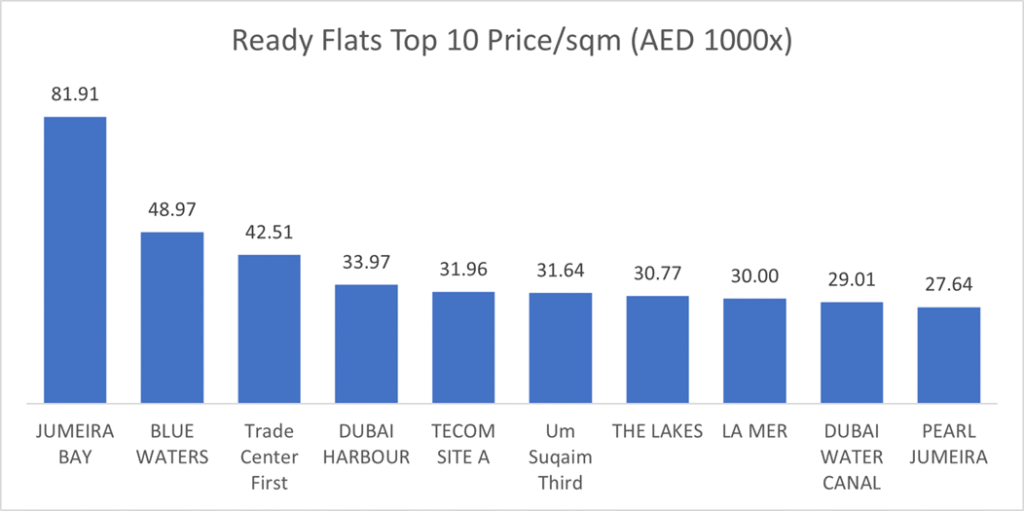
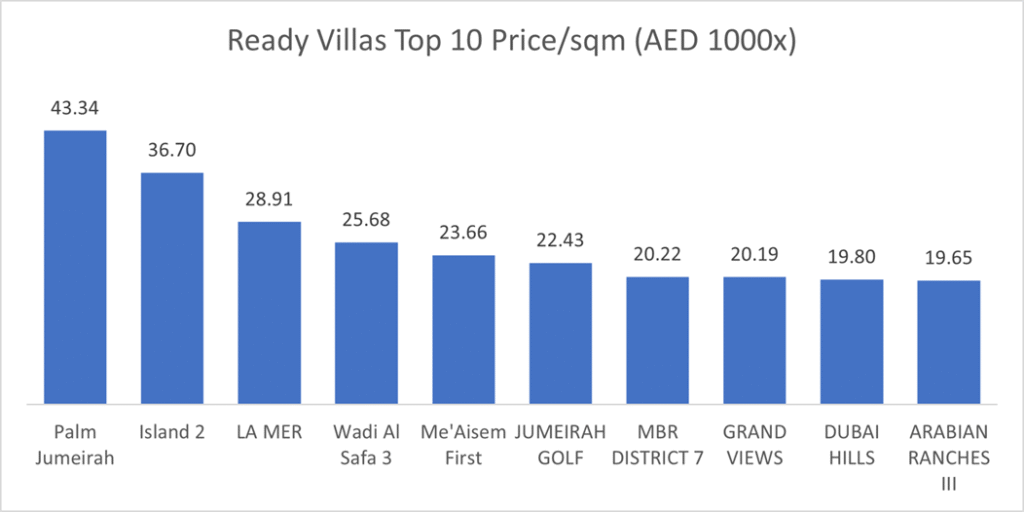
The average price per square meter for Ready Flats stood at AED 15,502, while Ready Villas averaged AED 13,689, almost unchanged from last month.
Land Transactions (Value)
Wadi Al Safa 3’s AED 4.82 bn mega-deals led the land market, followed by Ras Al Khor (AED 2.90 bn) and DIP Second (AED 1.66 bn). Notably, master-planned communities such as Dubai Hills and JVC also featured, signalling developer confidence in long-term residential plots.
On the Micro Level
Market Insights & Outlook
- Liquidity surge: Double-digit MoM and YoY gains point to unabated investor appetite despite global headwinds. Land’s 43 % share shows continued faith in future project pipelines.
- Apartment supremacy: Across both off-plan and ready, flats captured two-thirds to nearly 90 % of spend, reflecting affordability and rapid handover cycles.
- Consolidated hotspots: Business Bay and JVC remain the city’s bell-wethers; sustained volumes here often foreshadow broader market sentiment.
- Looking ahead: With new launches slated for Q3 and steady inflows of foreign capital, Dubai’s transaction momentum is expected to stay elevated, though selective end-user demand may narrow to projects with proven quality and payment flexibility.