

- April 20, 2026
- 7
- News&Media
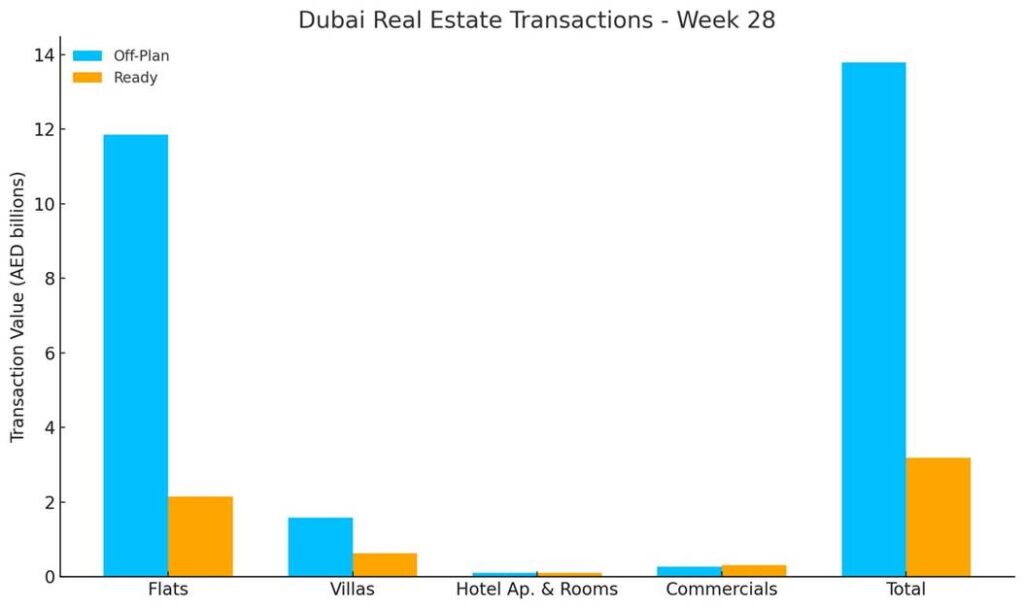
The total real estate transactions in Dubai for Week 28 was AED 16.99 billion and 8,526 transactions. Off-plan contributed 81.2% or 13.8 billion, while Ready properties contributed 18.8% or 3.2 billion.
In Week 28, Dubai’s real estate market recorded a total transaction volume of AED 16.99 billion, up 80.5 percent from last week’s AED 9.42 billion. Transaction count rose to 8,526 deals, an 84.1 percent increase over 4,632 in Week 27. Off-plan transactions dominated, accounting for 81.2 percent of volume, while ready properties made up the remaining 18.8 percent.
- One-bedroom Flats were the most traded, with 3.445 transactions.
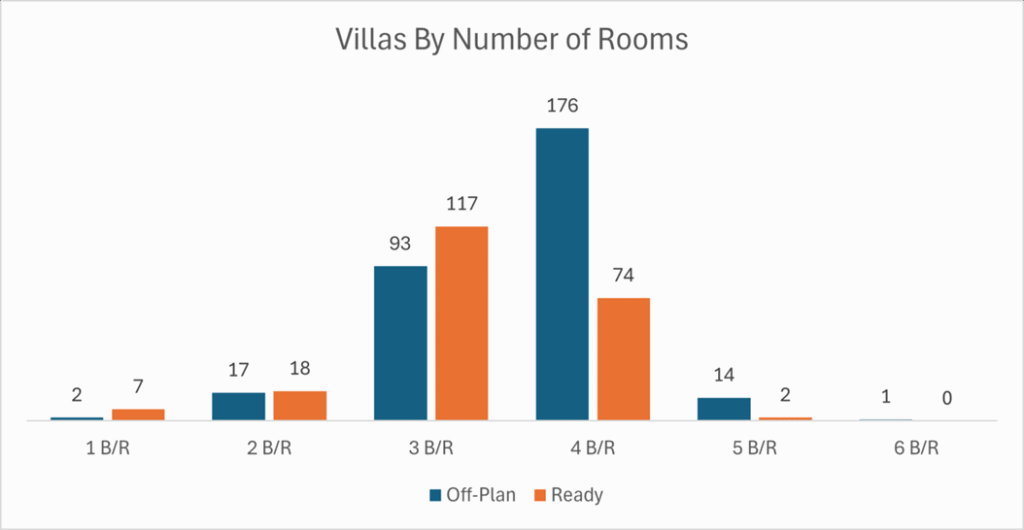
- 3-Bedroom & 4-Bedroom villas dominated the villas with 460 transactions combined.
- The total number of flats traded reached 7,681, while the villas accounted for 521 villas.
| Category | Off-Plan (AED million) | Ready (AED million) |
| Flats | 11,851.3 | 2,154.9 |
| Villas | 1,586.5 | 626.5 |
| H. Ap. & Rooms | 95.0 | 102.1 |
| Commercials | 266.6 | 307.2 |
| Total | 13,799.5 | 3,190.8 |
Off-Plan Market Performance
- Total Value: AED 13,799,490,548.72
- Share of Total Volume: 81.2 percent
| Subcategory | Value (AED) | % of Off-Plan |
| Flats | 11,851,300,300.49 | 85.9 % |
| Villas | 1,586,548,554.81 | 11.5 % |
| Hotel Ap & Rooms | 95,047,438.18 | 0.7 % |
| Commercials | 266,594,255.24 | 1.9 % |
Off-plan flats drove the segment at 85.9 percent of off-plan volume.
Top Performing Off-Plan Areas (by Value Traded)
| Area | Value (AED) |
| Madinat Al Mataar | 1,004,853,819.50 |
| Jumeirah Lakes Towers | 947,476,929.22 |
| Palm Jumeirah | 801,375,137.00 |
| Dubai Creek Harbour | 763,540,828.66 |
| Business Bay | 698,516,976.83 |
Ready Market Performance
- Total Value: AED 3,190,805,242.17
- Share of Total Volume: 18.8 percent
| Subcategory | Value (AED) | % of Ready |
| Flats | 2,154,905,917.31 | 67.6 % |
| Villas | 626,505,638.11 | 19.6 % |
| Hotel Ap & Rooms | 102,147,426.53 | 3.2 % |
| Commercials | 307,246,260.22 | 9.6 % |
Ready-market flats represented two-thirds of ready volume.
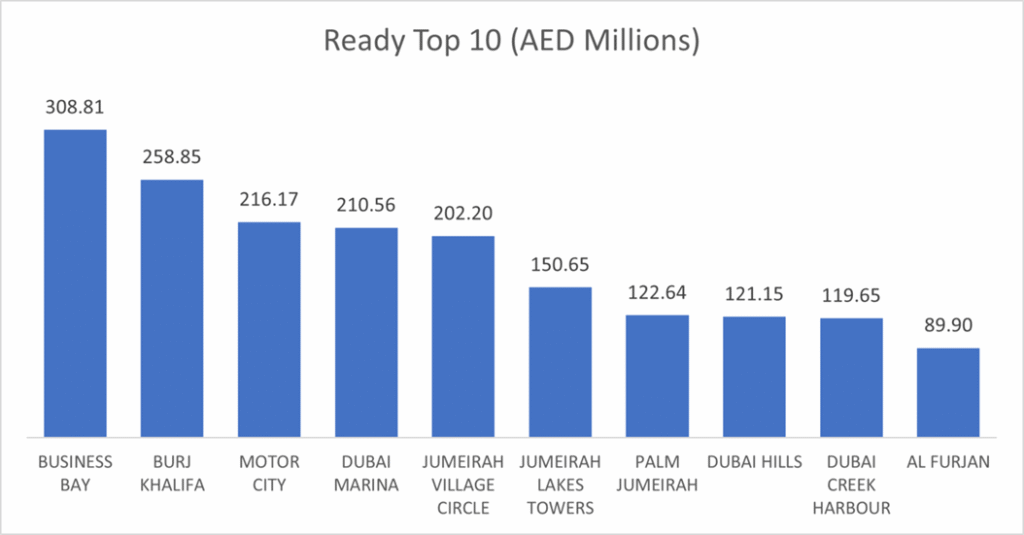
Top Performing Ready Areas (by Value Traded)
| Area | Value (AED) |
| Business Bay | 308,806,021.14 |
| Burj Khalifa | 258,846,240.03 |
| Motor City | 216,165,445.87 |
| Dubai Marina | 210,563,744.92 |
| Jumeirah Village Circle | 202,203,627.73 |
On the micro level, below is the sales distribution based on the number of bedrooms
Weekly Comparison
| Metric | Week 27 | Week 28 | Change |
| Total Volume | AED 9,416,507,893 | AED 16,990,295,790.89 | +80.5 % |
| Transactions | 4,632 deals | 8,526 deals | +84.1 % |
Market Insights & Outlook
The sharp surge in Week 28 was driven by off-plan activity, particularly in flats, which alone contributed nearly AED 11.9 billion. Madinat Al Mataar and Jumeirah Lakes Towers were the hottest off-plan locations, underscoring sustained investor confidence in emerging districts. On the ready market, Business Bay led volumes, reflecting steady secondary-market demand.