

- April 20, 2026
- 5
- News&Media
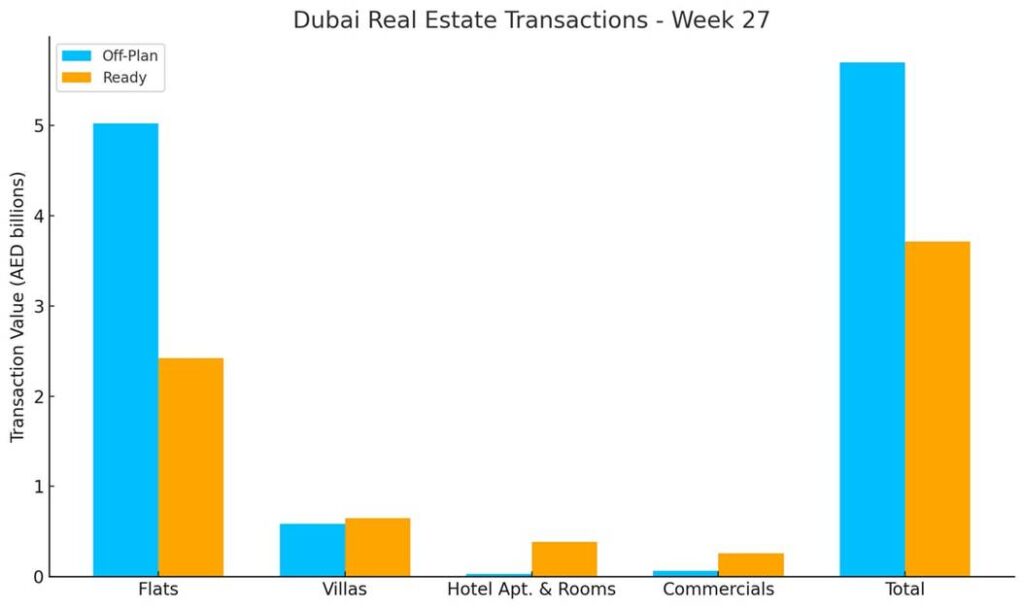
The total real estate transactions in Dubai for Week 27 was AED 9.42 billion and 4,632 transactions. Off-plan contributed 60.6% or 5.70 billion, while Ready properties contributed 39.4% or 3,71 billion.
Dubai’s real estate market experienced a solid rebound in Week 27 of 2025, with total transactions reaching AED 9.4165 billion, a 7.5 % increase compared to AED 8.7613 billion in Week 26. The number of deals also rose to 4,632 transactions, up from 4,298 the week before, marking renewed strength across both off-plan and ready segments.
- Oneberoom Flats were the most traded, with 1,842 transactions.
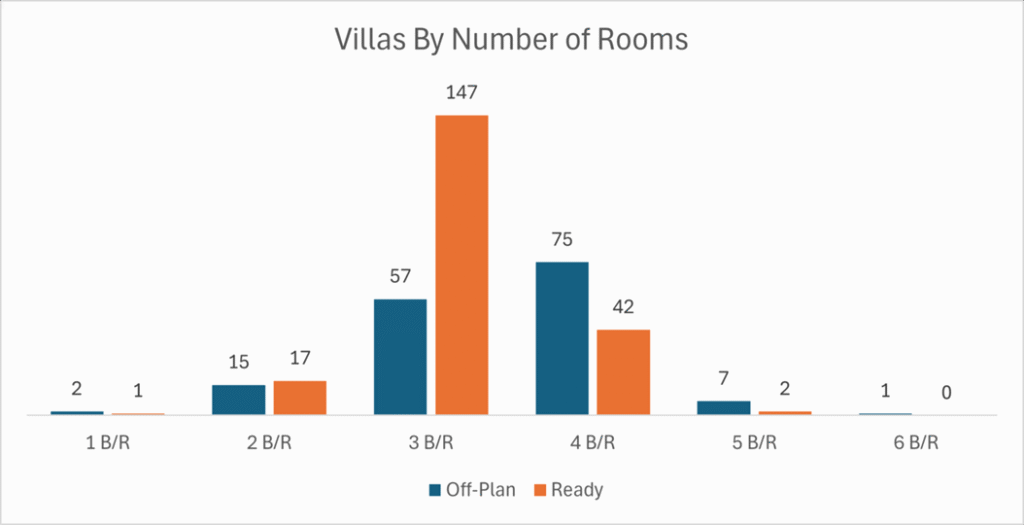
- 3-Bedroom & 4-Bedroom villas dominated the villas with 321 transactions combined.
- The total number of flats traded reached 4,040, while the villas accounted for 366 villas.
| Category | Off-Plan (AED millions) | Ready (AED millions) |
| Flats | 5,021.4 | 2,420.4 |
| Villas | 586.5 | 648.8 |
| Hotel Apartments & Rooms | 30.5 | 386.4 |
| Commercials | 63.4 | 259.0 |
| Total | 5,701.8 | 3,714.7 |
Off-Plan Market Performance
Total Value: AED 5,701.8 million
Share of Total Transactions: 60.6 %
| Subcategory | Value (AED) | % of Off-Plan |
| Flats | 5,021,427,315.26 | 88.1 % |
| Villas | 586,517,540.14 | 10.3 % |
| Hotel Apartments & Rooms | 30,491,939.00 | 0.5 % |
| Commercials | 63,378,004.49 | 1.1 % |
| Total | 5,701,814,798.89 | 100 % |
Apartments remained the dominant off-plan asset, making up over 88 % of segment volume, while villas contributed 10.3 % and hotel/commercial units together accounted for just 1.6 %.
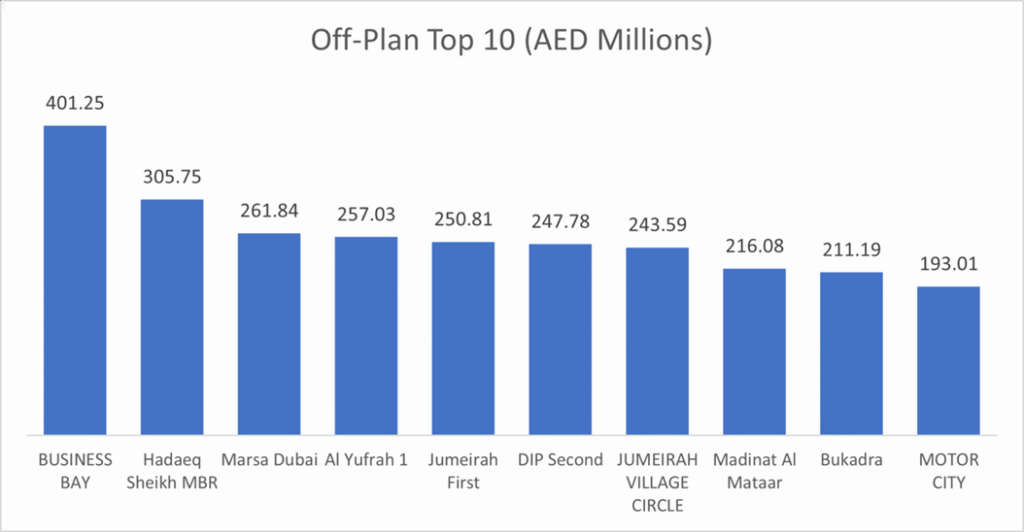
Top Performing Off-Plan Areas (by Value Traded)
| Area | Value (AED) |
| Business Bay | 401,254,249.27 |
| Hadaeq Sheikh MBR | 305,752,068.23 |
| Marsa Dubai | 261,841,640.42 |
| Al Yufrah 1 | 257,034,364.03 |
| Jumeirah First | 250,812,000.00 |
These five communities together represented AED 1,476,694,322, or 25.9 % of all off-plan transactions.
Ready Market Performance
Total Value: AED 3,714.7 million
Share of Total Transactions: 39.4 %
| Subcategory | Value (AED) | % of Ready |
| Flats | 2,420,429,716.27 | 65.2 % |
| Villas | 648,821,546.42 | 17.5 % |
| Hotel Apartments & Rooms | 386,434,655.42 | 10.4 % |
| Commercials | 259,007,175.89 | 7.0 % |
| Total | 3,714,693,094.00 | 100 % |
Flats led the ready market at 65.2 %, followed by villas at 17.5 % and hotel/commercial units at 17.4 %. It’s worth mentioning that the big jump in Hotel Appartments & Rooms transactions value was due to the sales of the Bonnington Tower Hotel & Residence for AED 157.2 million.
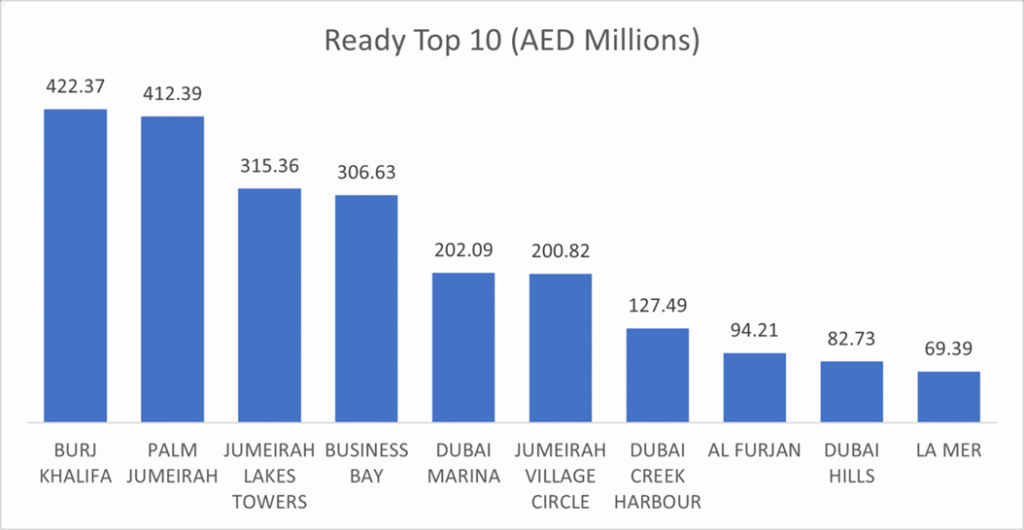
Top Performing Ready Areas (by Value Traded)
| Area | Value (AED) |
| Burj Khalifa | 422,369,602.11 |
| Palm Jumeirah | 412,387,917.61 |
| Jumeirah Lakes Towers | 315,361,026.47 |
| Business Bay | 306,634,617.40 |
| Dubai Marina | 202,086,787.20 |
These five districts accounted for AED 1,658,839,950, or 44.7 % of ready transactions.
On the micro level, below is the sales distribution based on the number of bedrooms
Weekly Comparison
| Metric | Week 26 | Week 27 | Change |
| Total Volume | AED 8,761,346,927 | AED 9,416,507,893 | +7.5 % |
| Transactions | 4,298 | 4,632 | +7.8 % |
Market Insights & Outlook
Week 27’s uptick underlines sustained appetite for new developments, with off-plan flats at the core of growth. The concentration of over 25 % of off-plan value in Business Bay and Sheikh Mohammed bin Rashid’s communities’ points to strong investor focus on established freehold hubs. In the ready segment, landmark addresses like Burj Khalifa and Palm Jumeirah continue to outperform, suggesting steady demand for trophy assets.